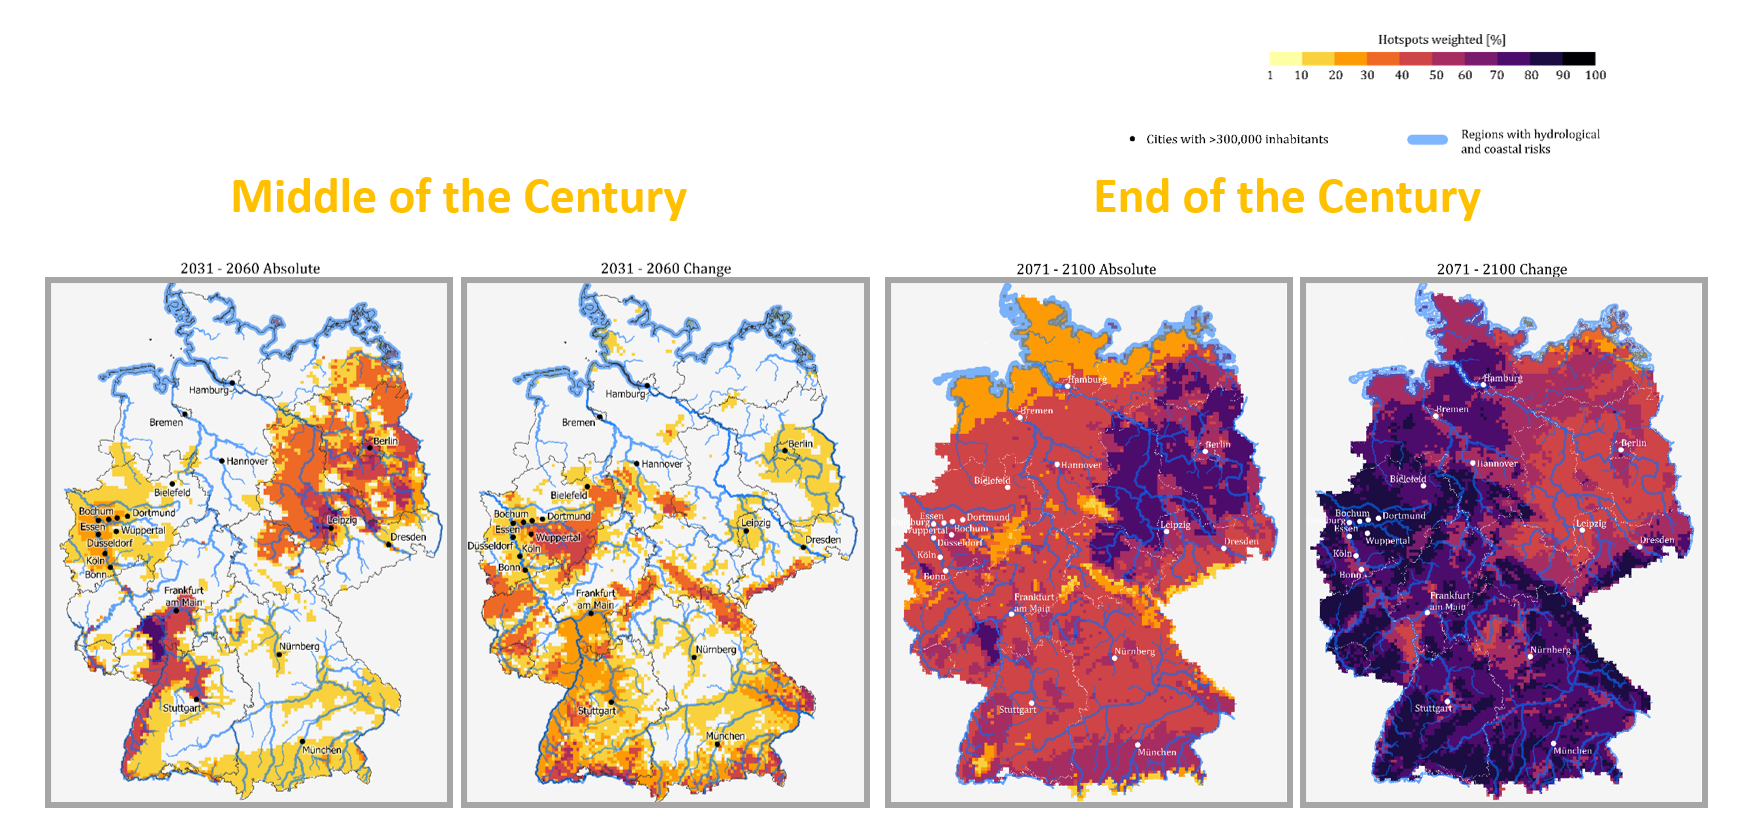
The graphic illustrates Germany’s climatic hotspots: maps of extreme values show regions that could be affected by a particularly large number of climatic extremes. Maps of changes show regions with potentially strong changes in climate parameters. The colours illustrate the strength of the impacts: 100% represents maximum impact in a region.
Map basis: © GeoBasis-DE / BKG (2020), © EuroGeographics, Deutscher Wetterdienst, © European Union
Quelle: KWRA 2021
Bild herunterladen (1,14 MB)