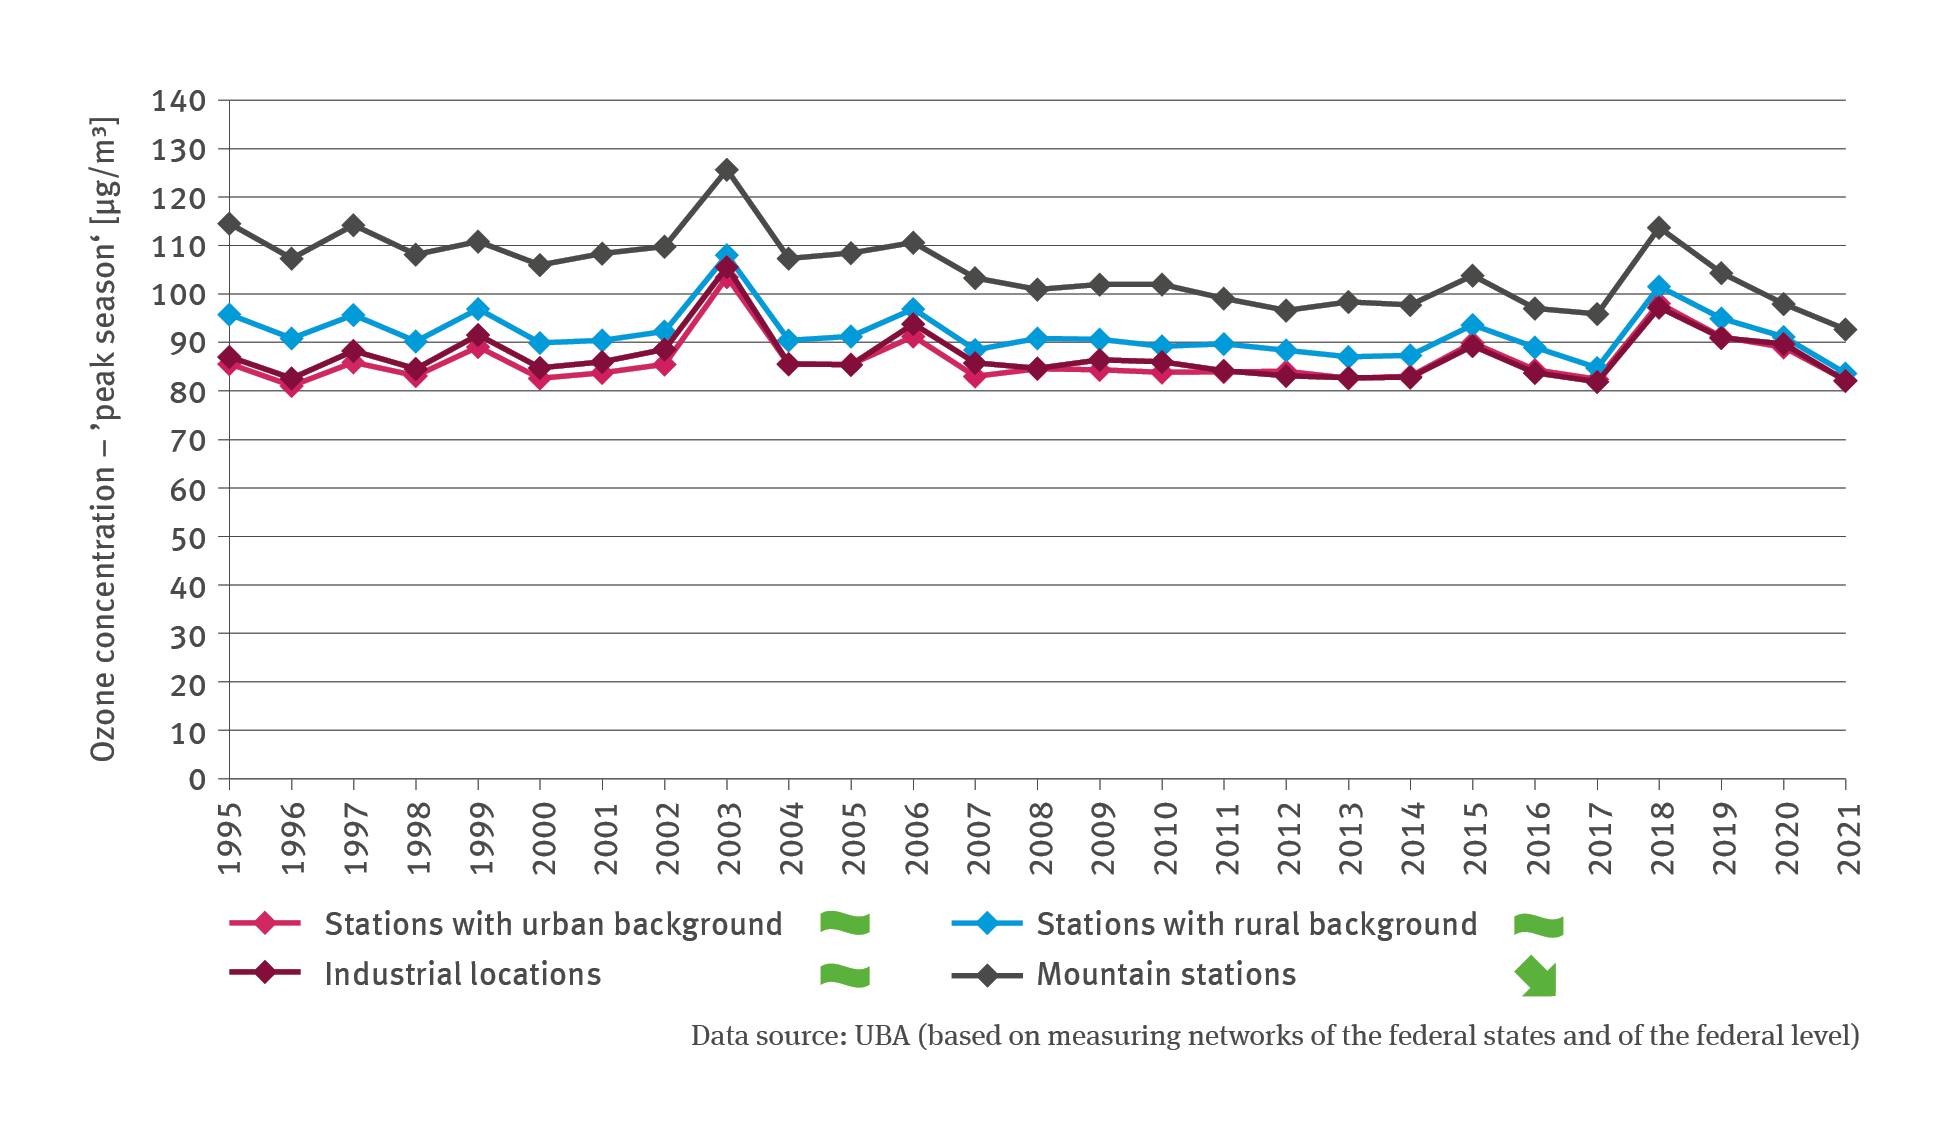
The line chart GE-I-9 ’Ozone burden’ shows the ozone concentration during the ’peak season’ in microgram (µg) per cubic metre from 1995 to 2021 annually. A differentiation is made between stations with an urban background, stations with a rural background, stations in industrial locations and stations in the mountains. For the stations in the mountains, a statistically significant regressive trend has been identified: The ozone concentration dropped from roughly 115 µg/m³ in 1995 to a little above 90 µg/m³ in 2021. This means that the ozone concentration is still higher than in the three other regions. At stations with an urban or a rural background, and in the industrial locations, the ozone concentration was at a similar level, latterly amounting to roughly more than 80 µg/m³. In all regions the ozone concentrations have decreased distinctly beginning in the years from 2018 onwards.