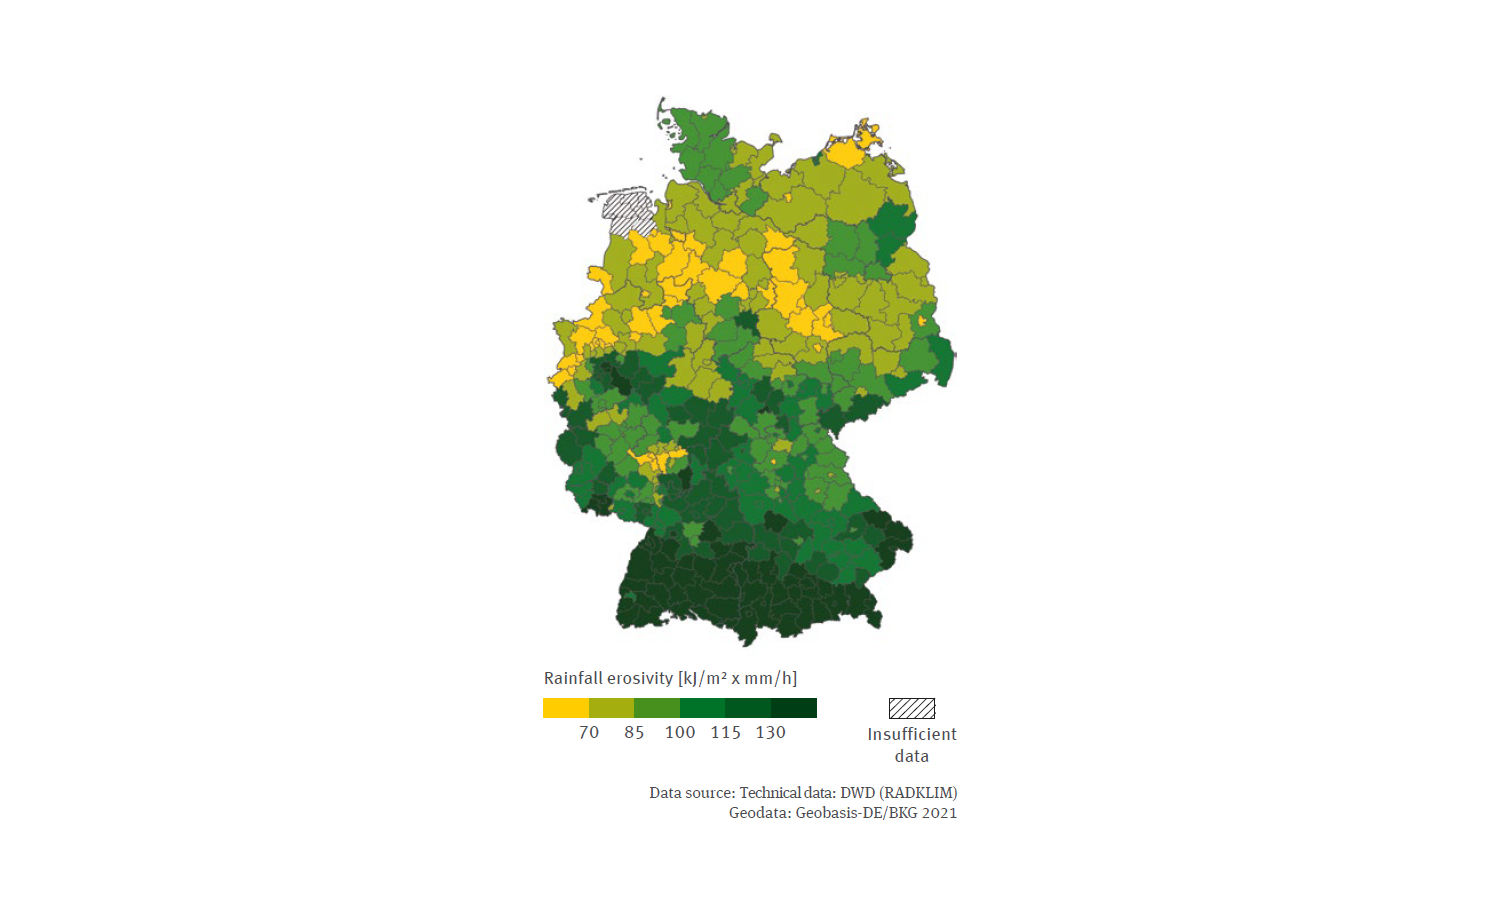
The legend comprises six categories for the rainfall erosivity (unit: kilojoules per square metre multiplied by millimetres per hour) as a district average for the years 2017 to 2021. The categories each comprise 15 units. The yellow-green colour spectrum ranges from yellow for values less than 70 to dark green for values greater than 130. There is also a category with black hatching on a white background for districts with insufficient data.
Source: Technical data: DWD (RADKLIM); Geodata: Geobasis-DE/BKG 2021
Download image (316.66 kB)