‘Hay fever’ is the colloquial, as well as trivialising term for a condition which is induced largely by allergenic pollen. However, hay fever is by no means harmless; it can be accompanied by major losses in quality of life and serious health impairments. Especially in cases where the allergic inflammation of nose and eyes extends to the bronchia, this can lead to chronic breathing difficulties (allergic asthma) and irreversible restructuring processes in the bronchia and lungs. One in three hay-fever sufferers will develop, in the course of their life, asthma that is associated with the pollen season but which can later become asthma that prevails all-year round.
Coming into contact with allergenic pollen in the environment is in many cases unavoidable or difficult to control. It is therefore absolutely essential to give allergy sufferers a chance to better understand the nature of their condition and of any underlying causes, thus enabling them to develop avoidance strategies. The following applies: the more allergy sufferers understand their condition, the less they suffer. In order to provide better and prophylactic information for people with pollen allergies, the DWD operates a pollen exposure risk index and the PID provides weekly pollen forecasts for Germany. During the season when pollen is airborne, this index provides information on the probable intensities of pollen burdens regarding the eight allergologically most important types of pollen (hazel, alder, ash, birch, sweet grasses, rye, mugwort and ragweed) expected to prevail during the current day and the two subsequent days. The weekly pollen forecast provides information on the eight types of pollen mentioned above and a number of other allergologically relevant pollen for the period of a week50. The up-to-date nature of these forecasts enables people who suffer from pollen allergies to arrange for targeted prophylactic actions in terms of adapting their behaviour and obtaining appropriate medication. Information on the stress risk expected can be downloaded direct via the internet on the respective websites operated by the DWD and the PID. Alternatively, there is an option to subscribe to a newsletter from either of these institutions.
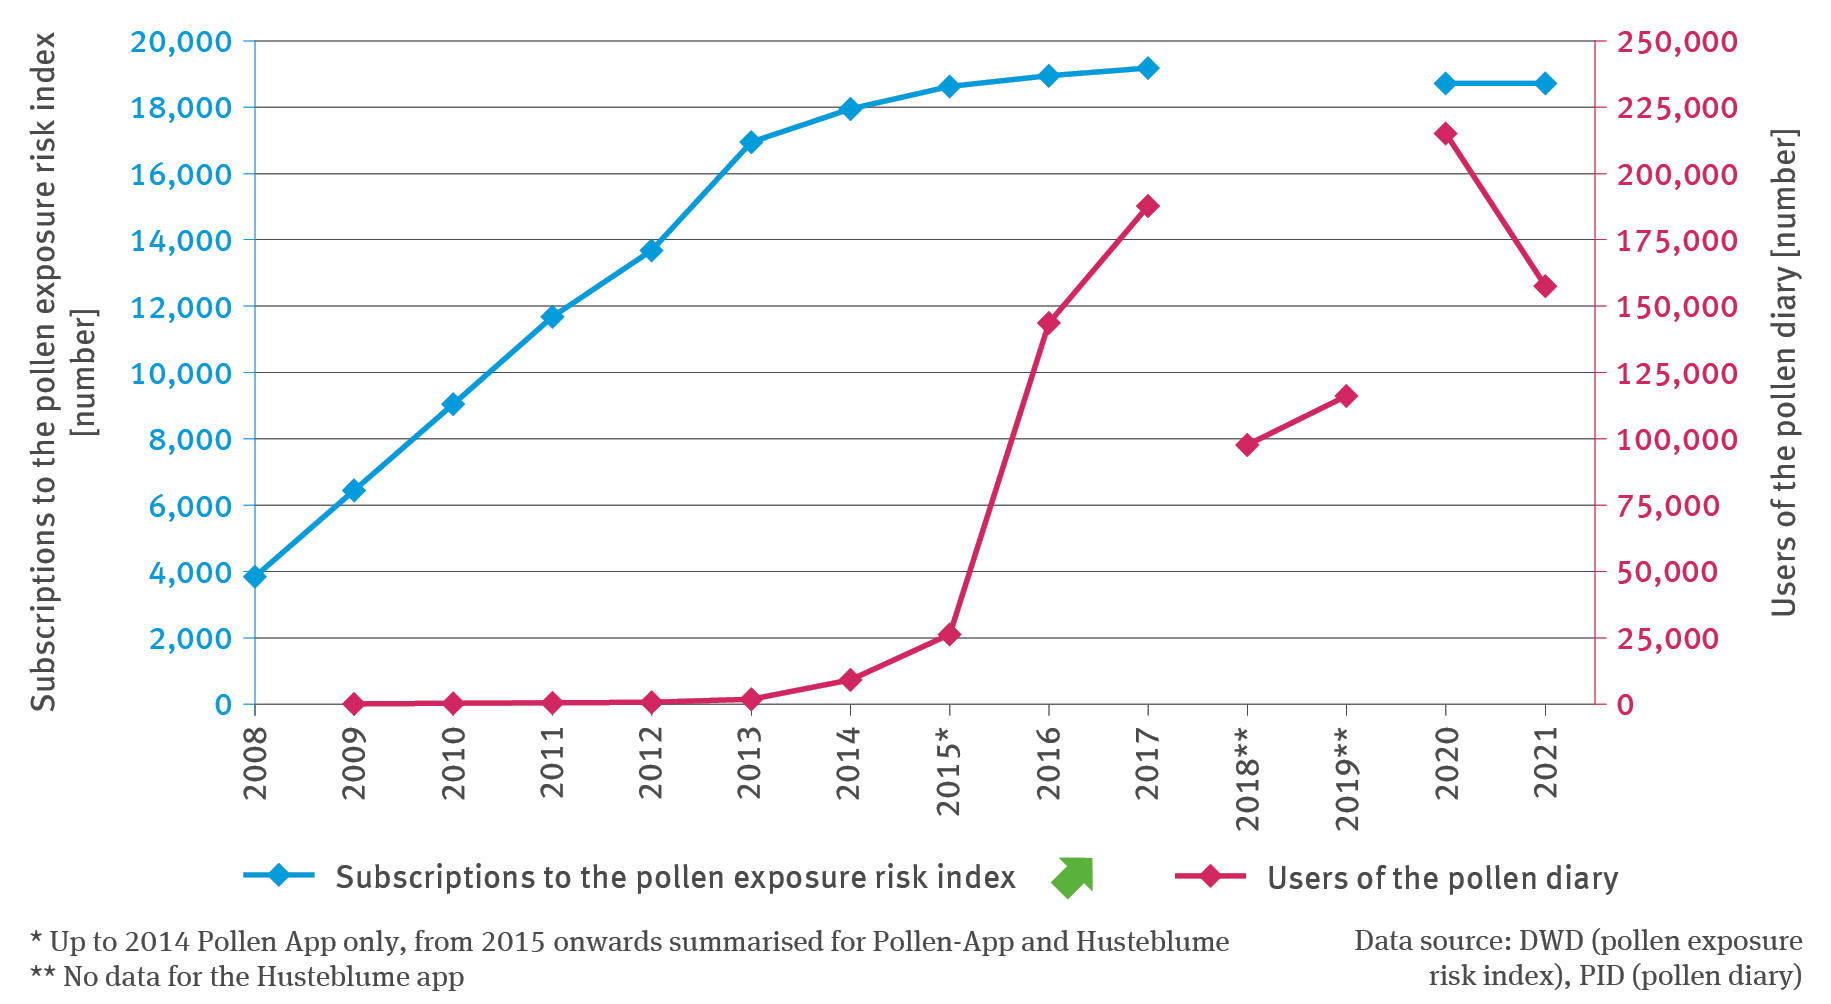
As in the case of heat warnings (cf. Indicator GE-R-1) there are no data on the DWD Newsletter subscriptions available for the years of 2018 and 2019 owing to the fact that the regulations in connection with the DSGVO (Datenschutz-Grundverordnung / General Data Protection Regulation) had not yet been issued at that time. In the years of 2020 and 2021 the subscription numbers stagnated. Presumably – similar to the situation with regard to heat warning newsletters – this is due to the growing use of apps which are more in accord with current usage behaviour. The pollen exposure risk index was incorporated in the DWD GesundheitsWetter-App which has been available since May 2020.
In addition to the pollen exposure risk index, the Medizinische Universität Wien / Austria in cooperation with the PID has since 2009 been developing further services offered for the support of allergy sufferers. The Online-Pollentagebuch (online pollen diary) was made available first. This enables people with hayfever to make connections between their current problems in eyes, nose and bronchia as well as their current medication, and the values of pollen activity in the location where they happen to be at any particular time (even if they happen to be staying in another European country). The daily records entered into the internet-based pollen diary helps allergy sufferers to compare – quickly and on their own – the intensity of their condition and the degree of current exposure to air-borne pollen. This enables them to see which type of pollen triggers what kinds of symptoms. In addition, the users of this diary are provided with an individual assessment of their pollen season. The pollen diary can also serve a patient’s GP or medical specialist as a useful aid in making a diagnosis and planning a therapy. In line with technological advances, a pollen app (‘Pollen App 7.3.1’51) was developed for smartphones in 2013. This app makes it possible to record the individual symptoms and their severity, at the same time as providing individual forecasts regarding likely medical complaints for the subsequent two days.
Since 2015 the Techniker Krankenkasse in cooperation with the PID has offered an app entitled ‘Husteblume’ (a pun on a children’s name for the seed heads of dandelions52. The contents of this app are identical with Pollen App 7.3.1. The Husteblume, in addition to the pollen exposure forecast and the recording of symptoms, also provides generic therapy tips. For the 2019 pollen season, the app was revised and expanded to include several new functions. The number of users who – via the Pollen 7.3.1 app and / or the Husteblume app – make entries into their pollen diary at various intervals during the year, has increased enormously since 2015. There are no data available for 2018 or 2019 regarding the Husteblume app which is the reason why the user numbers for those years appear to be distinctly lower. In 2021 almost 158,000 users made entries regarding their medical complaints in respect of nose, eyes and bronchia and the medication taken to alleviate those complaints. The significant decline in numbers for 2021 is to a large extent due to the impacts of the Covid-19 pandemic. Health topics other than allergies focused the public’s attention, and possibly the wearing of masks helped to reduce contacts with pollen allergens. It might also have been the case that – owing to the weather pattern – the pollen count at least of birch was distinctly lower in 2021 than in the previous dry and hot years (cf. Indicator GE-I-3). In 2022 the figures were distinctly higher again.
The large amount of data arising every year thanks to both apps being used by a great number of users, makes it possible to analyse the type and intensity of allergenic symptoms in Germany’s ‘hayfever population’53. Particularly welcome for the purpose of statistical analysis are the data from users who enter information into the app for at least five consecutive days. However, this differentiation is of no consequence in terms of the Indicator. An evaluation of the ‘Husteblume’ app shows that 56 % of users felt better informed about their allergy; while 34 % stated that they have been coping better with their allergy since using the app. 27 % of users report that the app has improved their quality of life54 Every eleventh user even states that their allergy has improved in general. The usage of the app over a year or during the pollen-relevant months – as stated in the study – showed that behavioural changes seem to be feasible, as the users of the Husteblume app sought medical assistance 7 % (mean) less frequently.
50 - Werchan B., Werchan M., Röseler S., Bergmann K.C. 2012: Die Wochenpollenvorhersage der Stiftung Deutscher Polleninformationsdienst (PID) – ein Hilfsmittel für Pollenallergiker und deren behandelnde Ärzte in Deutschland. 2021; 44: 920-926. doi: 10.5414/ALX02295.
51 - Pollen-App: https://www.pollenstiftung.de/pollenvorhersage/pollenapps.html
52- Husteblume – die Allergie-App der Techniker: https://www.tk.de/techniker/magazin/digitale-gesundheit/apps/husteblume-allergie-app-2025388
53 - Pfaar O., Karatzas K., Bastl K., Berger U., Buters J., Darsow U., Demoly P., Durham S.R., Galán C., Gehrig R, van Wijk G.R., Jacobsen L., Katsifarakis N., Klimek L., Saarto A., Sofiev M., Thibaudon M., Werchan B., Bergmann K.C. 2020: Pollen season is reflected on symptom load for grass and birch pollen-induced allergic rhinitis in different geographic areas – An EAACI Task Force Report. Allergy. 2020 May; 75(5): 1099–1106. doi: 10.1111/all.14111
54 - Husteblume – Allergie-App der Techniker: cf. endnote no. 52