Apart from the increasing average temperature, climate change will presumably also entail more health problems related to stressful heat events such as more frequent, more intensive and more persistent heatwaves. High temperatures impose burdens on health. Most affected are the elderly and individuals with chronic diseases such as cardio-vascular of respiratory diseases.
Looking back it is possible to discern a trend towards increasing numbers of ‘hot days’ (with a daily maximum temperature of 30 °C or more) and of ‘tropical nights’ with a temperature minimum of 20 °C or more since the 1970s. Contrary to hot days, tropical nights have so far occurred relatively seldom in our climes. It can be stated, however, that years with distinctive heatwaves have also regularly led to the development of tropical nights. Tropical nights are of particular relevance to health, as in those nights, especially after very hot days, the chance of getting a good night’s rest is rather limited.
As far as tropical nights are concerned, it has to be borne in mind when interpreting the time series that the area mean for Germany underrates the actual stress, especially in urban areas, where most of the tropical nights occur. In the DWD climate measuring network, there are distinctly fewer urban measuring stations than background measuring stations. The latter indicate the mean for tropical nights at a lower level.
In 2005, the DWD launched a heat warning system. Since then, the criteria for heat warnings have been continuously developed further. Currently warning stage 1 is announced when at least ‘major heat stress’ is forecast (subject to regional adaptation in the course of summer) of approximately 32 to 38 °C ‘perceived temperature’ when, as a result, interior rooms do not cool down adequately at night. Warning stage 2 comes into force when the threshold value for extreme heat stress amounting to 38 °C ‘perceived temperature’ is exceeded, even when interior rooms cool down sufficiently at night (cf. Indicator GE-R-1).
Ever since the heat warning system came into operation, there have been weather-dependent fluctuations in the annual mean number of heat warnings in the so-called warning districts which follow the general outlines of administrative districts. An exceptionally high number (for the area mean) of heat warnings were issued on more than ten hot days in 2006, 2010, 2013, 2015 and 2018. Compared to the time series of hot days, there are years in which the number of heat warning days is higher than that of hot days, as against years in which the opposite applies. The ‘perceived temperature’ – relevant in terms of heat warnings – is determined with due consideration of a typical human being’s temperature perception. Air humidity can play an essential role in this context. By contrast, hot days are based solely on air temperature data. The summer of 2018 was characterised by the highest number of hot days to date, but also by extreme drought. Owing to the fact that ‘dry heat’ is less stressful to health, fewer heat warning days were recorded than in 2015. On the other hand, the summer heatwaves in 2015 were accompanied by higher humidity. From June to mid-July and from the end of July onwards, the weather pattern prevailing at the time led to the influx of subtropical and humid hot air masses from the Mid-Atlantic and North-West Africa into Central Europe. From the middle to the end of July, a high-pressure system over the Azores dictated the sultry weather. In 2015, this situation resulted in the highest number of heat warnings in relation to extreme heat issued to date.
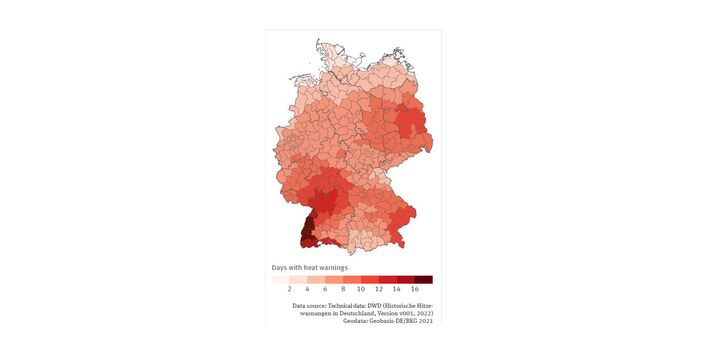
The spatially differentiated illustration of the mean number of heat warnings in the years from 2017 to 2021 demonstrates that there are major regional differences in the extent of stress. As expected, most affected are individual warning districts along the Upper Rhine from Baden-Württemberg in the south, and to Bingen in Rhineland-Palatinate. The Upper Rhine Rift Valley between the mountain ranges of the Black Forest and the Vosges acts like a heat storage basin; this area received an additional influx of warmth from the French part of the Rhône valley which is partly subject to Mediterranean influences. Further high values were recorded in the north-western parts of Baden-Württemberg such as the Neckar-Odenwald district, Heilbronn and Ludwigsburg, which are subject to the warm air emanating from the equally favoured Neckar valley.
Hot days and tropical nights as well as heat warnings indicate weather patterns that are apt to cause health burdens. However, they do not permit drawing any inferences as to how many individuals are actually affected by related health problems (cf. Indicator GE-I-2).


