Climate change makes itself felt in terms of rising air temperatures and a changing precipitation regime. The seasonal distribution of precipitation and its intensity are undergoing changes. Such changes influence the entire water balance, in other words, they affect evaporation, soil water, the formation of seepage water, the replenishment of groundwater, surface discharge on one hand as well as surface waters being fed by groundwater, on the other.
The water budget sums up all components of the water balance. In other words, the difference between precipitation, evaporation and regional discharge is equivalent to the terrestrial water storage. The latter encompasses water in various compartments: Groundwater, soil water, water in lakes, rivers and dams (such as reservoirs) and any water bound up in ice and snow. In the course of the past 20 years, terrestrially stored water has decreased significantly. In strongly simplified terms, this means that in Germany as a whole there is less water available now than just 20 years ago.
Regarding the data underpinning the indicator, they were submitted by the satellite mission GRACE (Gravity Recovery and Climate Experiment, 2002–2017) and its follow-up mission GRACE-FO (GRACE Follow-On, 2018–2023). These satellites are used to observe temporary fluctuations in the Earth’s gravitational field. Mass distribution is not the same everywhere on the Earth, as there are liquid rock masses moving around in the Earth’s interior, while in the oceans and on the continents, there are water masses and air masses on the move at all times. This uneven distribution of masses means that the Earth’s gravitational force is not distributed evenly across the globe; in other words, in places where more mass is present, the gravitational field is a little stronger than elsewhere. In contrast with processes involving radar or optical procedures, satellite gravimetry is able to capture not just storage compartments near the surface, but also deep in the underground.
The GRACE Mission was conceived specifically to improve global insights into the impacts of climate change and to gain a more comprehensive knowledge of the processes involved. Among other findings, the mission revealed that between 2002 and 2016, the Greenland ice masses diminished annually by roughly 270 billion tonnes57.
Upon the elimination of atmospheric water content above the land mass of Central Europe, GRACE makes it possible to capture changes in the amounts of terrestrially stored water. As a result, it is now possible to compare also the water volumes calculated by means of hydrological models with the measurements obtained indirectly.
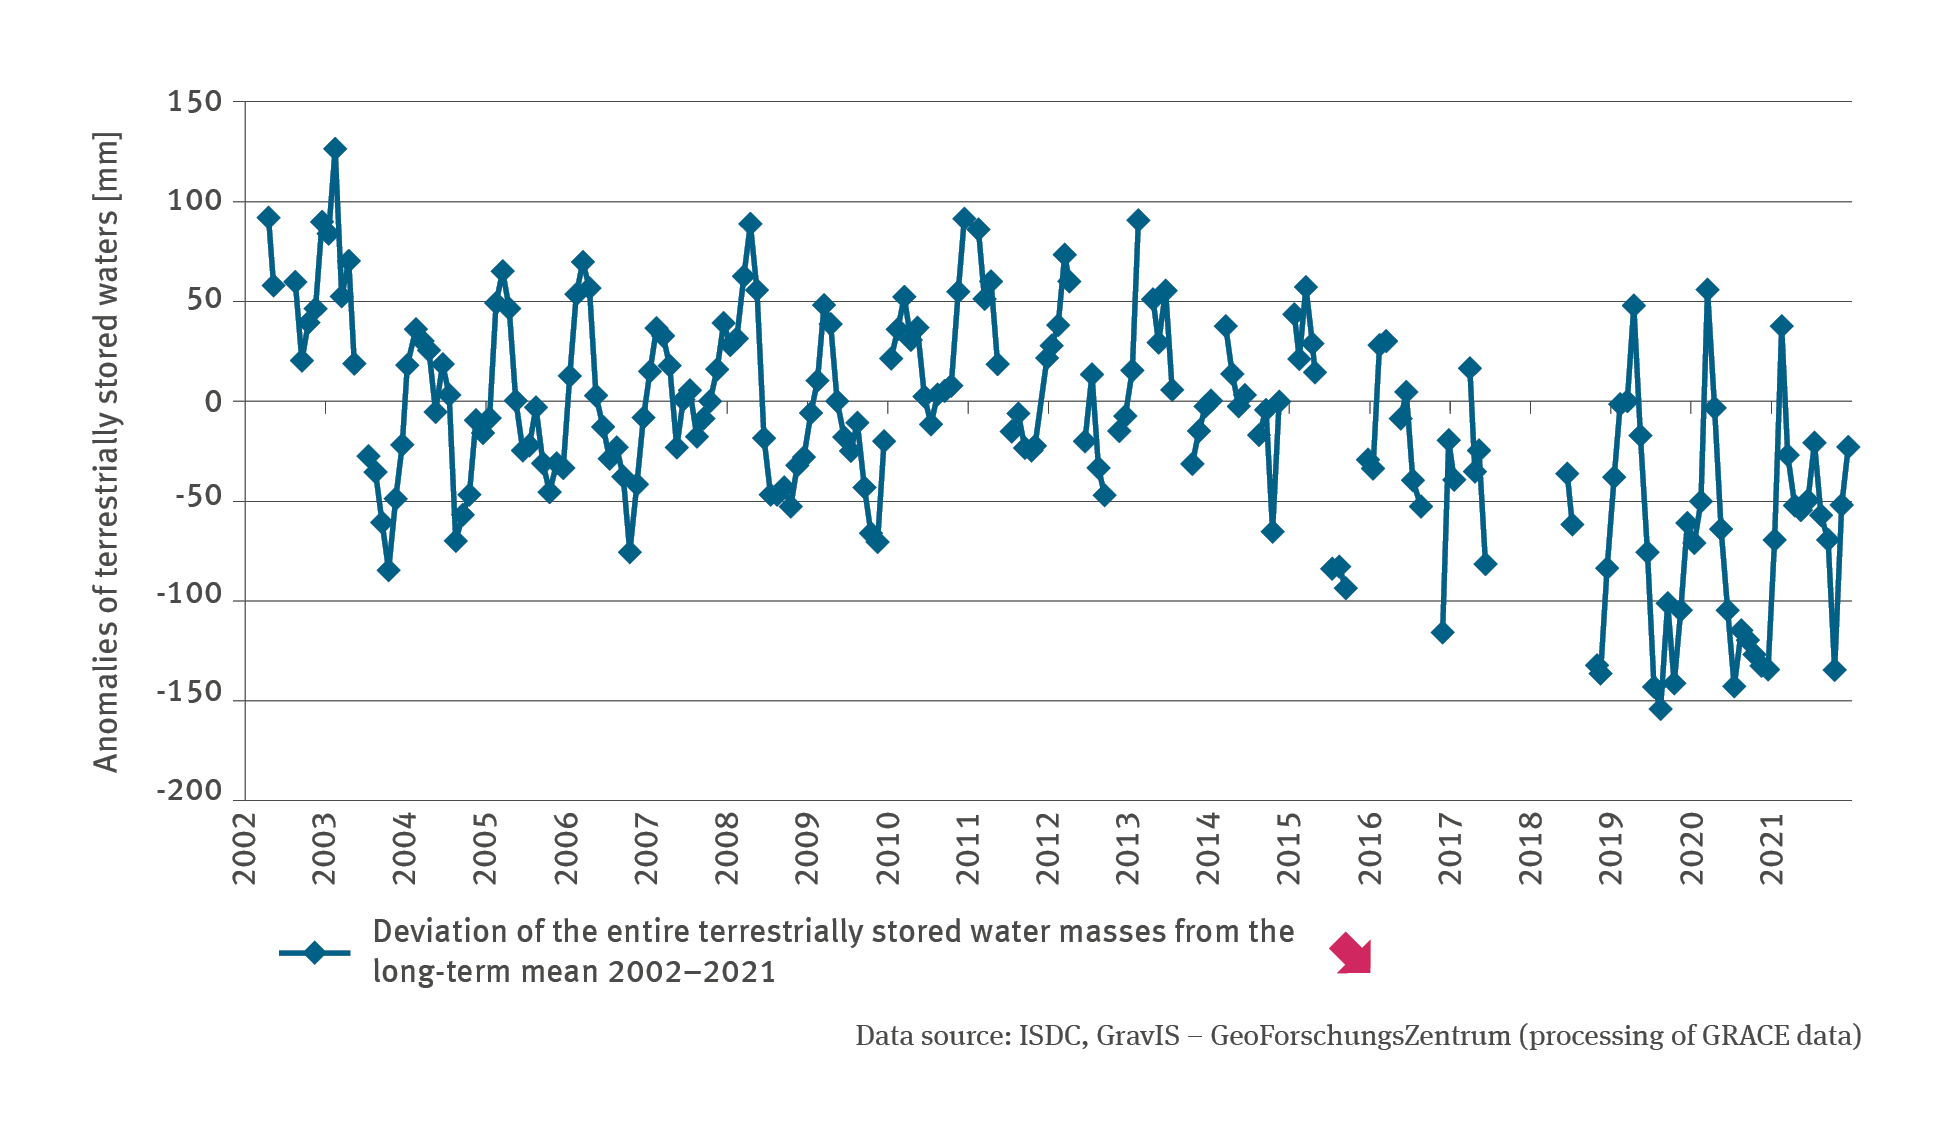
The spatial resolution of the satellite data amounts to 300 kilometres. Subsequent processing enabled the calculation of higher-resolution grid data (approximately 110 km length by 70 km width) thus providing a sufficiently detailed resolution for the entire Federal Republic, with the exception of coastal areas. The time series for Germany provides a very clear illustration of pronounced flood events, for instance the events which occurred in 2011 and 2013 (cf. Indicator WW-I-4) and the effects of the drought period from 2018 to 202058. Nevertheless, there are gaps in the data for 2018 as the first GRACE Mission ended in 2017 while GRACE FO was not launched until May 2018. The data coverage during the transitional period between the two missions was insufficient. Other major data gaps occurring in 2015 are due to battery problems on board of GRACE which made it necessary to switch off the instruments temporarily. The increased noise noticeable during the deployment of GRACE FO – in other words the greater amplitude of data – is due primarily to increased solar activity which leads to increased friction on the satellites
In the indicator presented, the deviations from the long-term mean of the entire 20-year time series of 2002–2021 were determined on the basis of the absolute values obtained monthly. Months in which the precipitation exceeds the water loss from evaporation and discharge, are incorporated in the time series showing a positive anomaly. Months in which evaporation predominates show a negative anomaly.
In terms of absolute numbers, Germany is one of the regions worldwide which have the highest loss of water. Since the turn of the millennium the country has been losing 2.5 gigatonnes or cubic kilometres of water annually. Looking at the two decades overall, this amount is equivalent to the water contents of Lake Constance. Obviously, this is an enormous volume of water.59
The time series shows distinct matches with the measurement series (as presented in this chapter) – regarding the groundwater level (cf. Indicator WW-I-2), floodwater (cf. Indicator WW-I-4) uand low-water levels (cf. Indicator WW-I-6) as well as water levels in lakes (cf. Indicator WW-I-7).
57 Büker M. (Helmholtz) 2018: Mission GRACE-FO. Satelliten vermessen das Schwerefeld der Erde. https://www.helmholtz.de/newsroom/artikel/satelliten-vermessen-das-schwerefeld-der-erde/
58 - Boergens E., Güntner A., Dobslaw H., Dahle C. 2020: Quantifying the Central European Droughts in 2018 and 2019 with GRACE follow-on Geophysical Re-search Letters, 47 (14), p. 1672. doi: 10.1029/2020GL087285
59 Roth D. 2022: Hydrologen warnen: Deutschland trocknet aus. National Geographic. https://www.nationalgeographic.de/umwelt/2022/03/hydrologen-warnen-deutschland-trocknet-aus