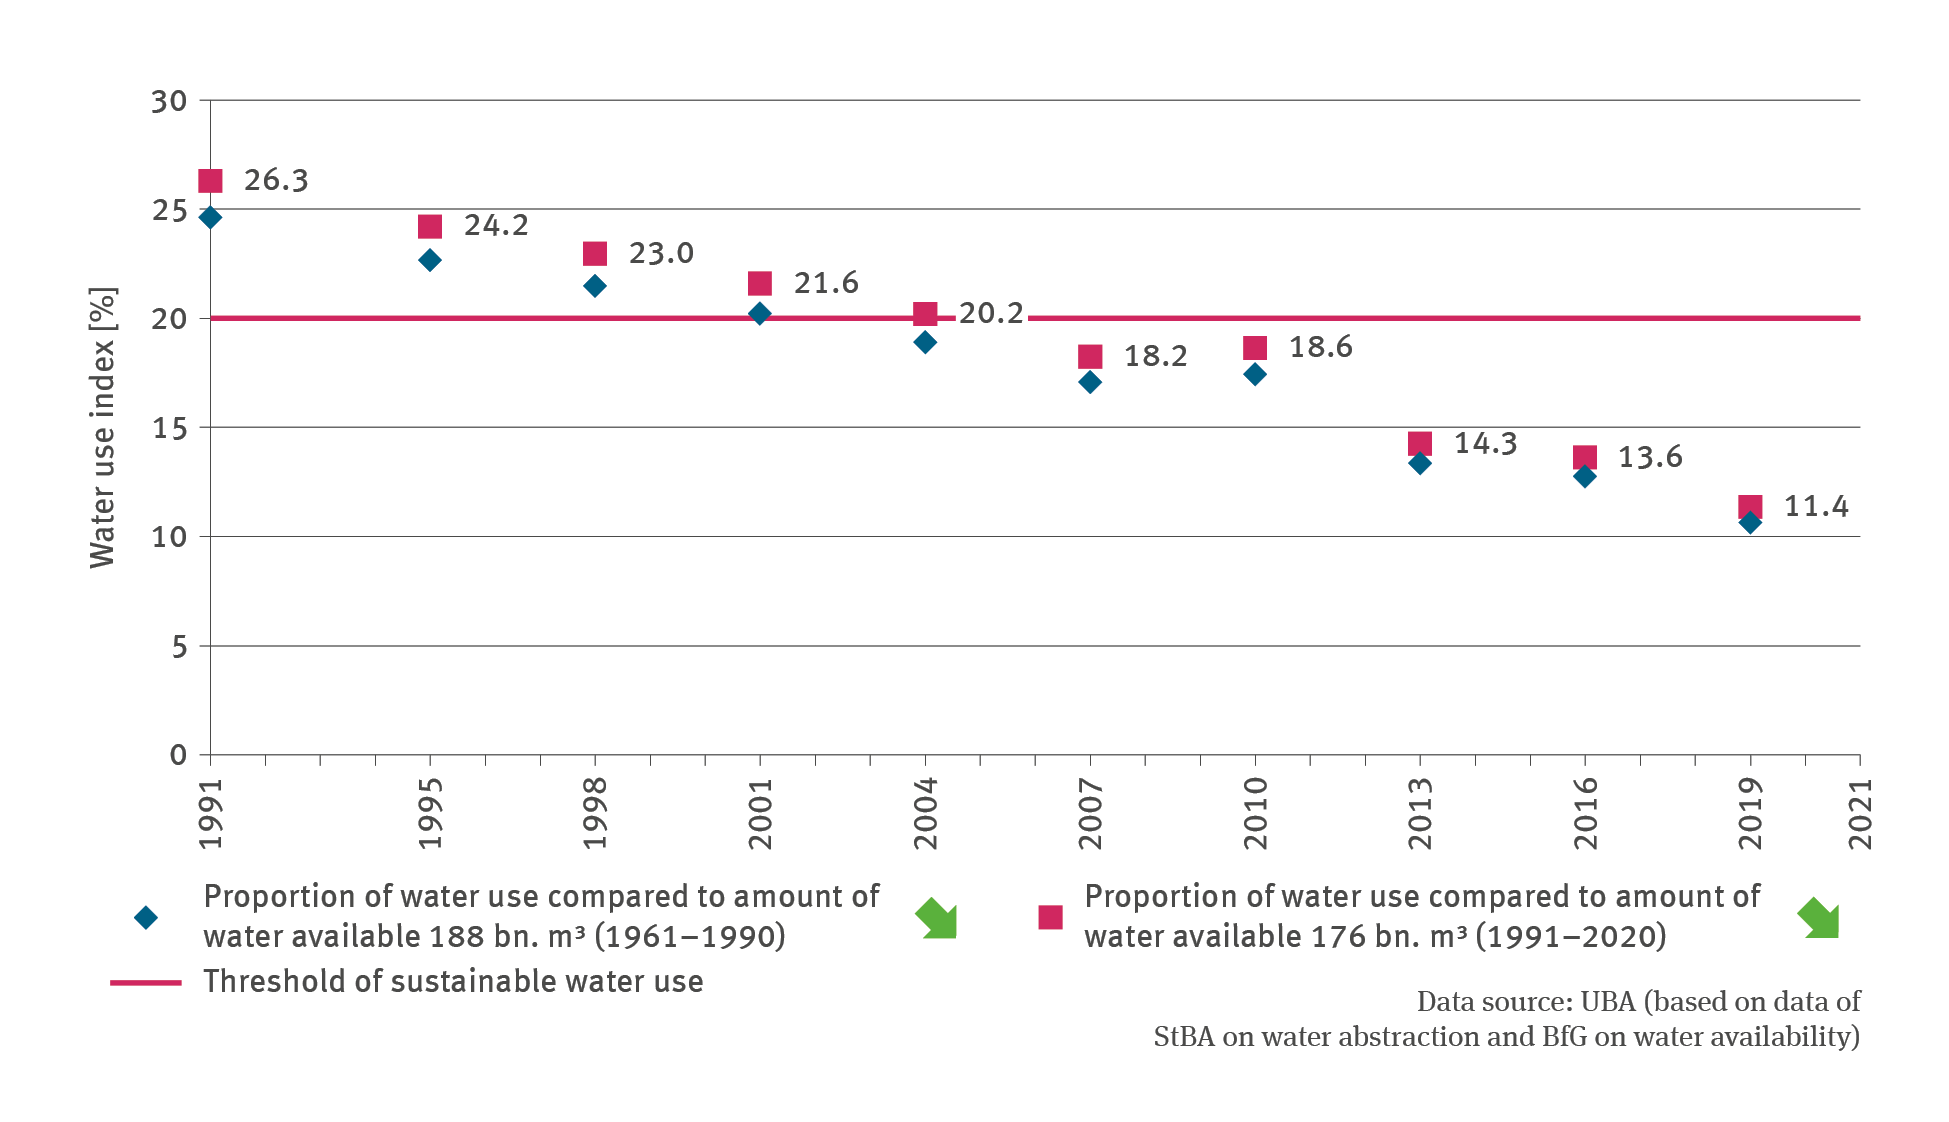
The droughts prevailing in the years 2018 to 2020 and in 2022 demonstrate that in Germany too, there are challenges from seasonally and regionally decreased water volumes, which have to be addressed much more vigorously. As far as the long-term mean of the period 1961–1990 is concerned, roughly 188 billion cubic metres of groundwater and surface water were considered potentially available water resources; by comparison, the mean of the period 1991–2020 with roughly 176 billion cubic metres is lower.
Extended and more frequently occurring drought periods and low-water periods can – owing to a decrease in the volume of water available – cause regional utilisation conflicts regarding surface water and groundwater abstraction (for instance for the purpose of irrigation in agriculture and horticulture, cf. Indicator LW-R-6). This is true, in particular, for central parts of eastern Germany, the north-eastern German lowlands and the south-eastern German basin where unfavourable climatic water budgets occur; in other words, where comparatively little rain falls while evaporation of water is high owing to high summer temperatures.
The water use index provides basic clues as to whether the usage of water resources in Germany is sustainable or whether water shortages are developing. Cases of water abstraction can be termed sustainable as long as they do not exceed the threshold of 20 % of available water supply. Notably, the 20 % threshold is an internationally valid benchmark. Once water usage exceeds this threshold, this is regarded as a sign of water stress. Values of 40 % and above are termed high water stress. The causes for exceeding this threshold can be sought in an increased water abstraction or scarcity of naturally available water supplies. In calculating the indicator, the annual public and non-public water abstraction in terms of water use has been contrasted with the long-term availability of water supplies.
Owing to a reduction in both the commercial and private water usage in Germany, this 20 % threshold has been undercut regularly since 2004. Overall the values recorded in the water use index have been declining significantly since 1991. Hence it follows that according to internationally valid benchmarks, the extent of water usage can be considered sustainable. Energy producers as well as industrial and mining operations have contributed to this distinct reduction; as these companies clearly command the greatest share (70 %) of water usage (cf. Indicator IG-R-1). Coolant abstraction by power plants for energy generation accounted for the lion share of commercial water usage. Consequently, efficiency improvements in terms of recycling or cyclical usage, had particularly favourable effects on the water budget, at least until 2007. In view of the closure of the last remaining nuclear power plants after the April 2023 temporarily extended deadline, it is expected that cooling water abstraction by power plants will decrease further.
Likewise, water use by private households and small businesses was reduced substantially since 1991 from 144 litres per person per day to 123 litres per person per day in 2016. However, thereafter water use increased slightly again to 128 litres in 2019. More recent figures are not available. However, there are signs indicating that in 2020 and 2021, the impacts of the Covid-19 pandemic also affected water use, given that private households required more water on account of home offices, home schooling, cancelled travel arrangements and increased hygiene requirements. In addition, another trend evolved that has led to increased private use of water, unfortunately at a time when water supplies are already less abundant. Private and other swimming pools are becoming ever more popular. Such pools typically have major capacity for water, and the pools will probably be refilled with fresh water several times per season. An estimate on the basis of a survey involving roughly a thousand respondents – a representatively selected number of Hamburg residents66 – has shown that up to 6 % of the entire annual consumption of drinking water is taken up by households in the city state of Hamburg during the summer months. The numbers involved add up to relevant scales. Peaks in drinking water consumption can also be attributed to the irrigation of gardens.
The water use index used as an indicator so far does, however, have its limitations when it comes to illustrating the adaptation requirements and related activities in the water management. An overview of the situation nationwide does not take into account any distinct regional differences within Germany. In future, the water budget – owing to climate change and a further decrease in summer precipitation as well as increased evaporation e.g. in eastern Germany – might become even more unfavourable by reducing the availability of water in that area (cf. Indicator WW-I-2). Moreover, in individual years, the renewable water resource is subject to strong fluctuations, thus distinctly undercutting the long-term mean underpinning the indicator67. At the same time, extended heat periods may – at least temporarily – lead to an increased demand for water.
The overall decreasing water usage on one hand and the climate-induced higher consumption peaks on the other as well as variations in the regional distribution of water resources and water demand, confront water providers with new challenges. In particular the managers of water providers in rural areas and in upland regions who have largely decentralised as well as precipitation-dependent supply structures (such as municipality-owned wells), may be confronted with predicaments during prolonged drought periods. Nevertheless, with regard to central or pipeline-based supply systems, it has been possible so far to keep a balance between the local or regional supply of, and temporary differences in, demand for water. Even in the case of several consecutive years of persistent drought, the drinking water supply for the population must be safeguarded. With this in mind, the conscious and conscientious saving of water continues to be important. An individual who saves water, is saving energy at the same time, because energy is used not just for supplying warm water but also for its supply in general and, of course, its treatment.
66 - Liehr S., Lüdtke D. 2021: Hamburger Wasserverbrauchsstudie 2021 – Begleit-Analyse der Ergebnisse. ISOE – Institut für sozial-ökologische Forschung, Frankfurt am Main, 12 pp. https://www.isoe.de/fileadmin/Edit/PDF/Publ/2021/Wasserverbrauchsstudie-2021_Begleit-Analyse_ISOE.pdf
67 - Informationen des UBA zu Wasserressourcen und ihre Nutzung: https://www.umweltbundesamt.de/daten/wasser/wasserressourcen-ihre-nutzung#die-wasserressourcen-deutschlands