Skip to main content Skip to main menu Skip to footer

KM-I-6: Pumping station performance – case study

The illustration KM-I-6 ’Pumping station performance – case study’ contains a biaxial chart. By means of three scatter charts, the time series illustrates the annual performance of pumping stations on the Treene river, at the Kiel Canal and on the Eider river respectively, for the period from 2005 to 2021, in kilowatt hours per hectare.
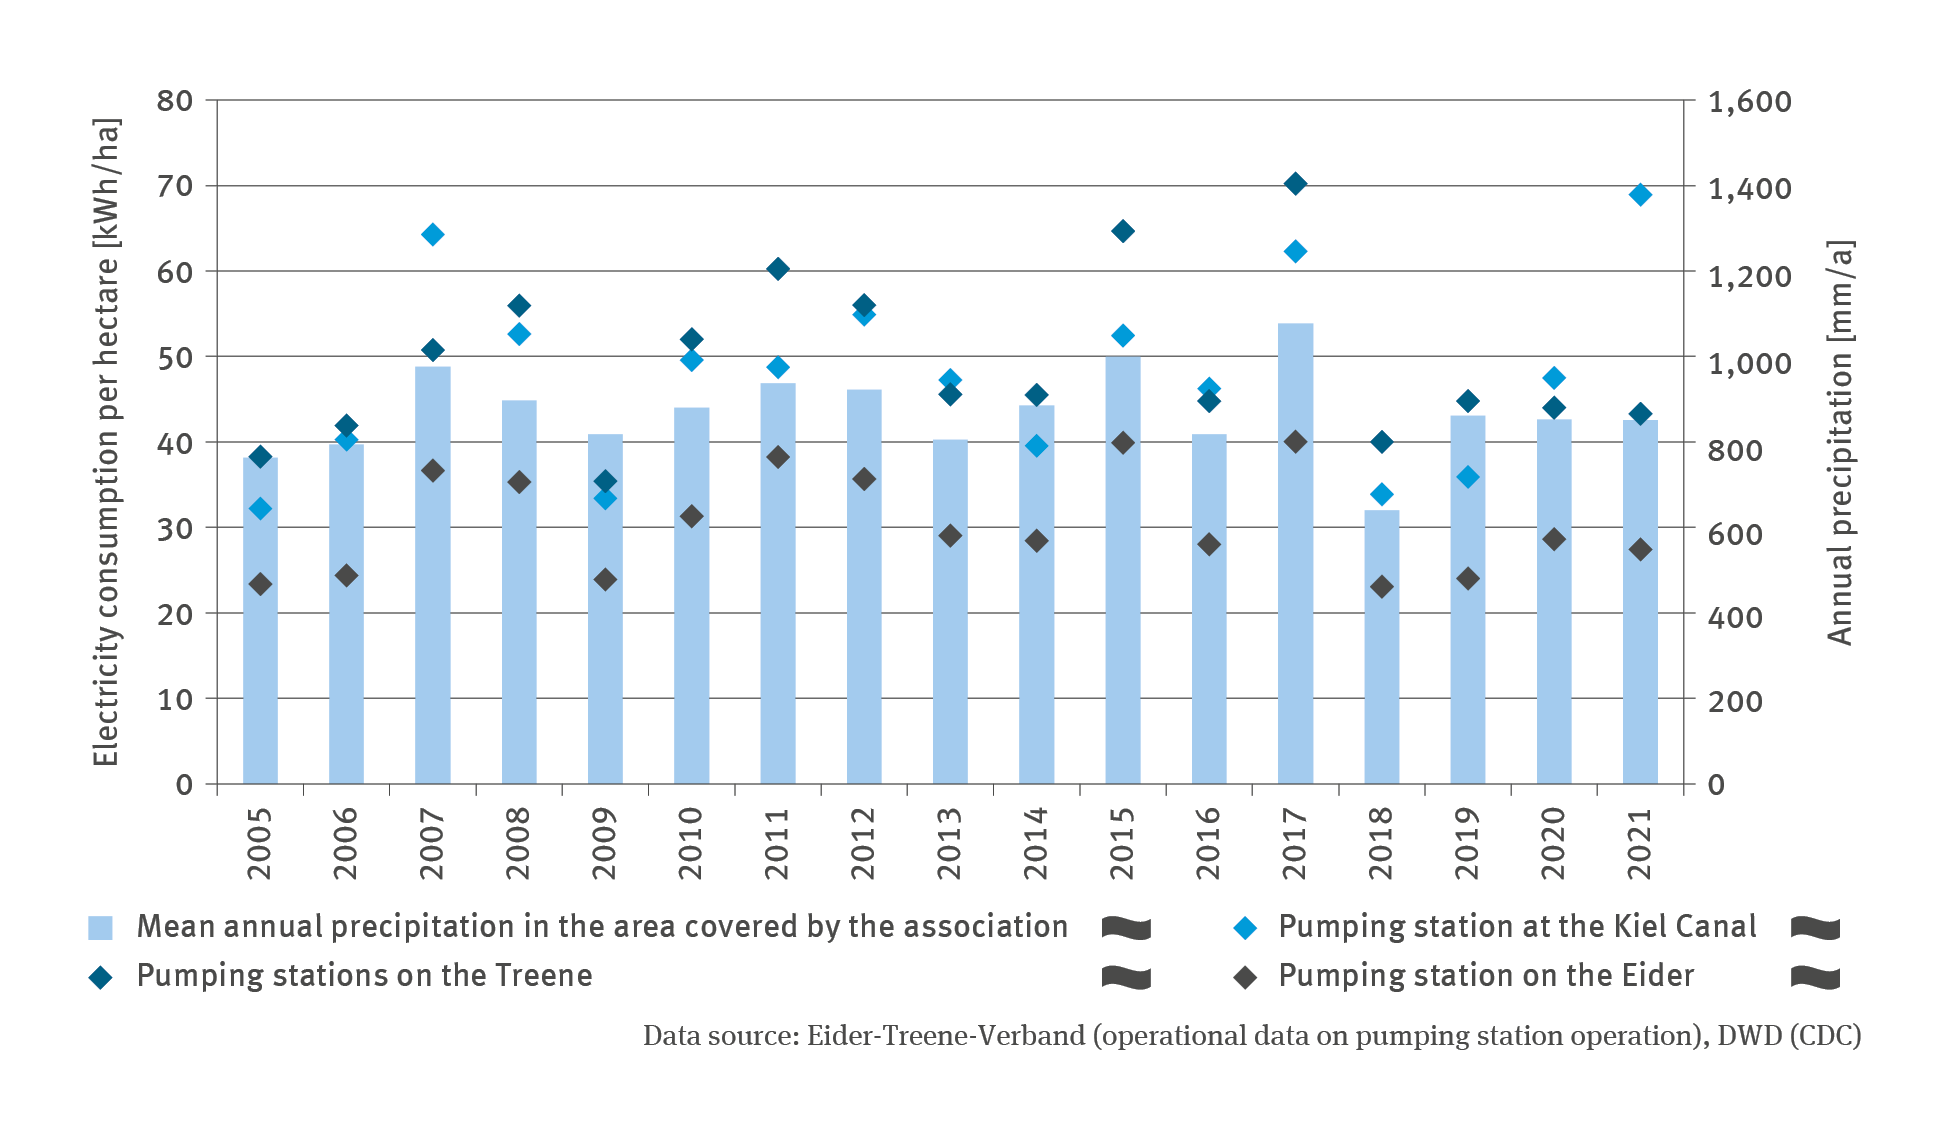
Source: Eider-Treene-Verband (operational data on pumping station operation)/ DWD (CDC)
Download image (103.58 kB)

The following contents contain this medium:

Short link: www.uba.de/m111443en