Skip to main content Skip to main menu Skip to footer

KM-I-3: Height of storm surges

The line chart KM-I-3 ’Height of storm surges’ shows the moving 19-year mean of the annual maximum tidal high water in centimetres with reference to NHN for six selected gauging stations in the North See and Baltic Sea. Depending on data availability the time series illustrate the years from 1843 the earliest and 1963 the latest to 2021.
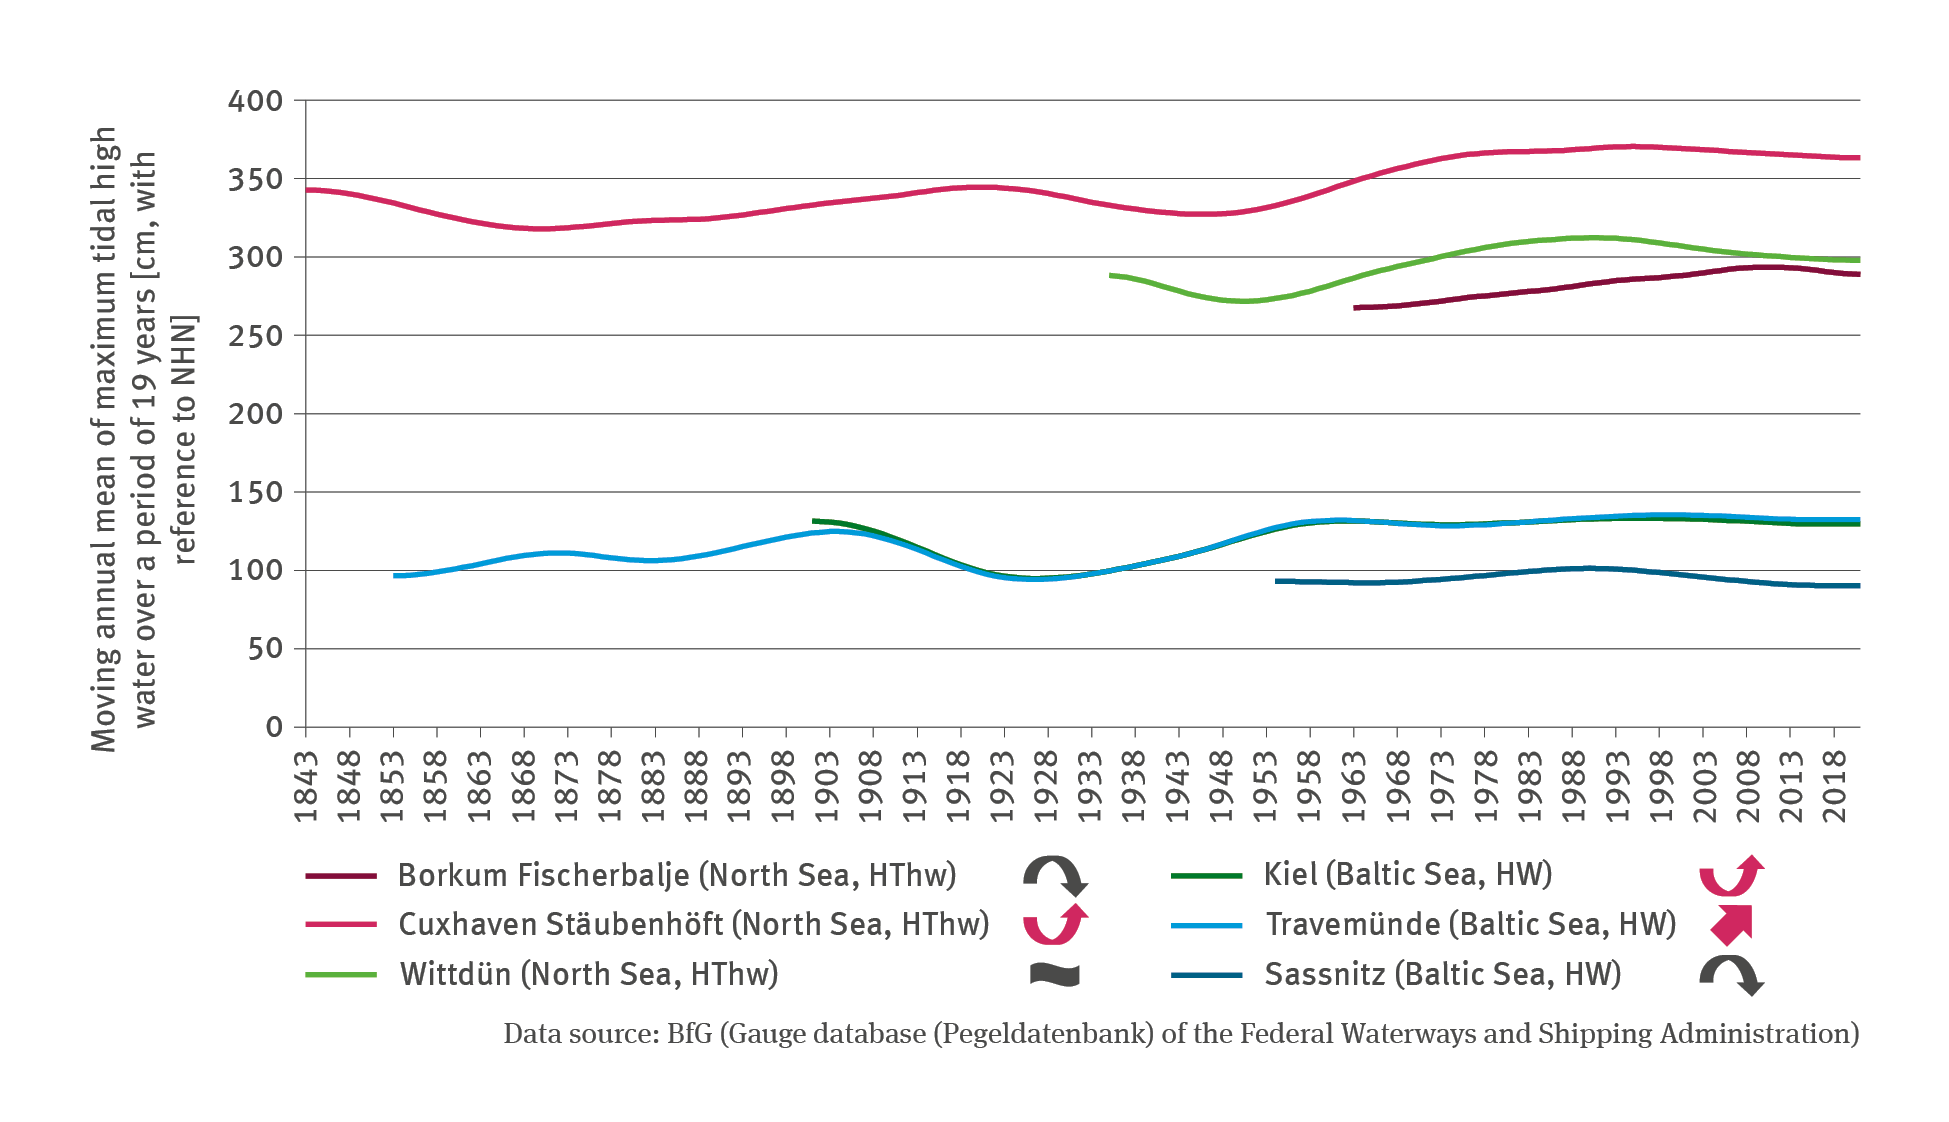
Source: BfG (Gauge database (Pegeldatenbank) of the Federal Waterways and Shipping Administration)
Download image (138.01 kB)

The following contents contain this medium:

Short link: www.uba.de/m111434en