Skip to main content Skip to main menu Skip to footer

IG-R-2: Exposure of Germany’s foreign trade to global climate change

The illustration IG-R-2 ‘Exposure of Germany’s foreign trade to global climate change’ contains a biaxial chart. This chart shows the foreign trade volume for the period from 2008 to 2020 in respect of countries exposed to a particular climate risk. Owing to a change in the assessment method for the ND-GAIN Index the time series between 2013 and 2014 is discontinuous. Stacked columns show the foreign trade volume separately for imports and exports.
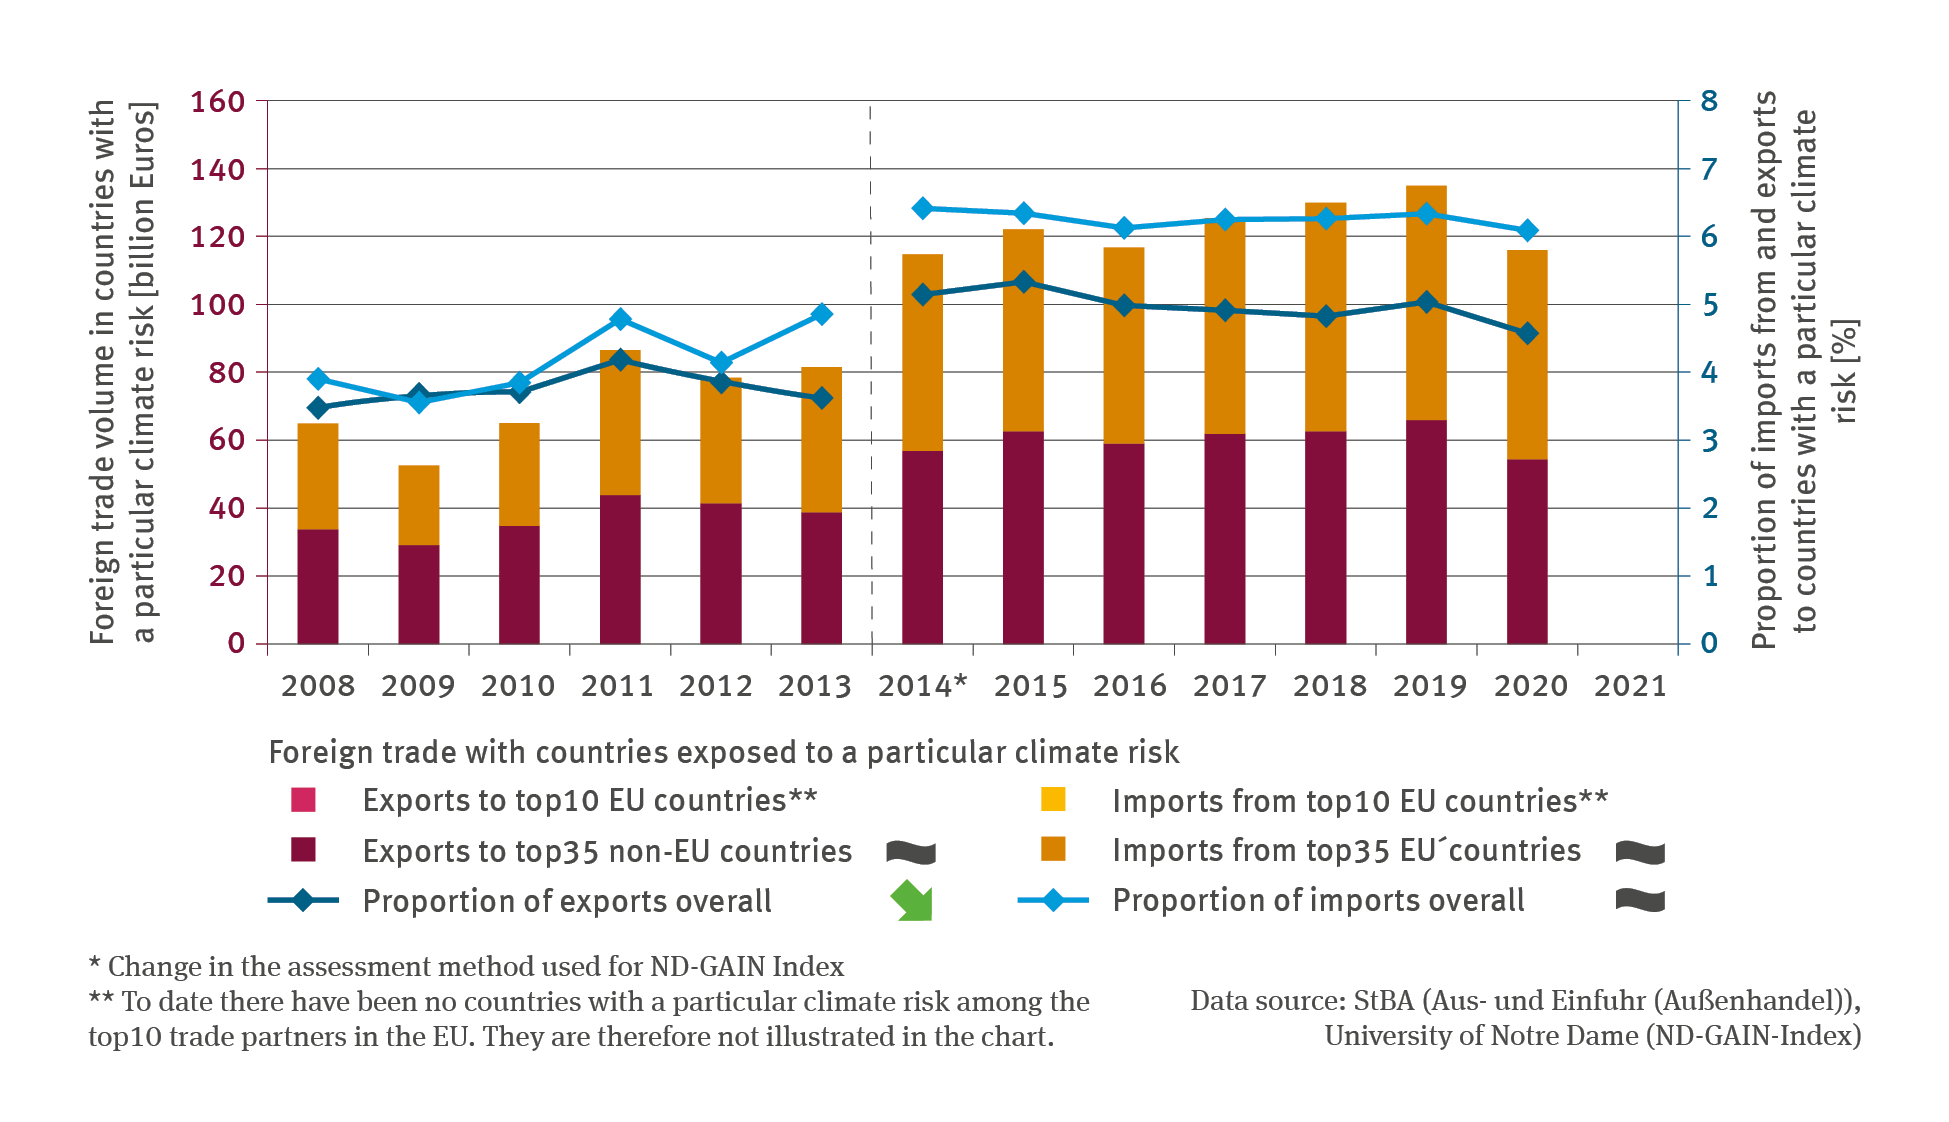
Source: StBA (Aus- und Einfuhr (Außenhandel))/ University of Notre Dame (ND-GAIN-Index)
Download image (153.77 kB)

The following contents contain this medium:

Short link: www.uba.de/m111863en