Skip to main content Skip to main menu Skip to footer

GE-I-9: Ozone burden

The line chart GE-I-9 ’Ozone burden’ shows the ozone concentration during the ’peak season’ in microgram (µg) per cubic metre from 1995 to 2021 annually. A differentiation is made between stations with an urban background, stations with a rural background, stations in industrial locations and stations in the mountains.
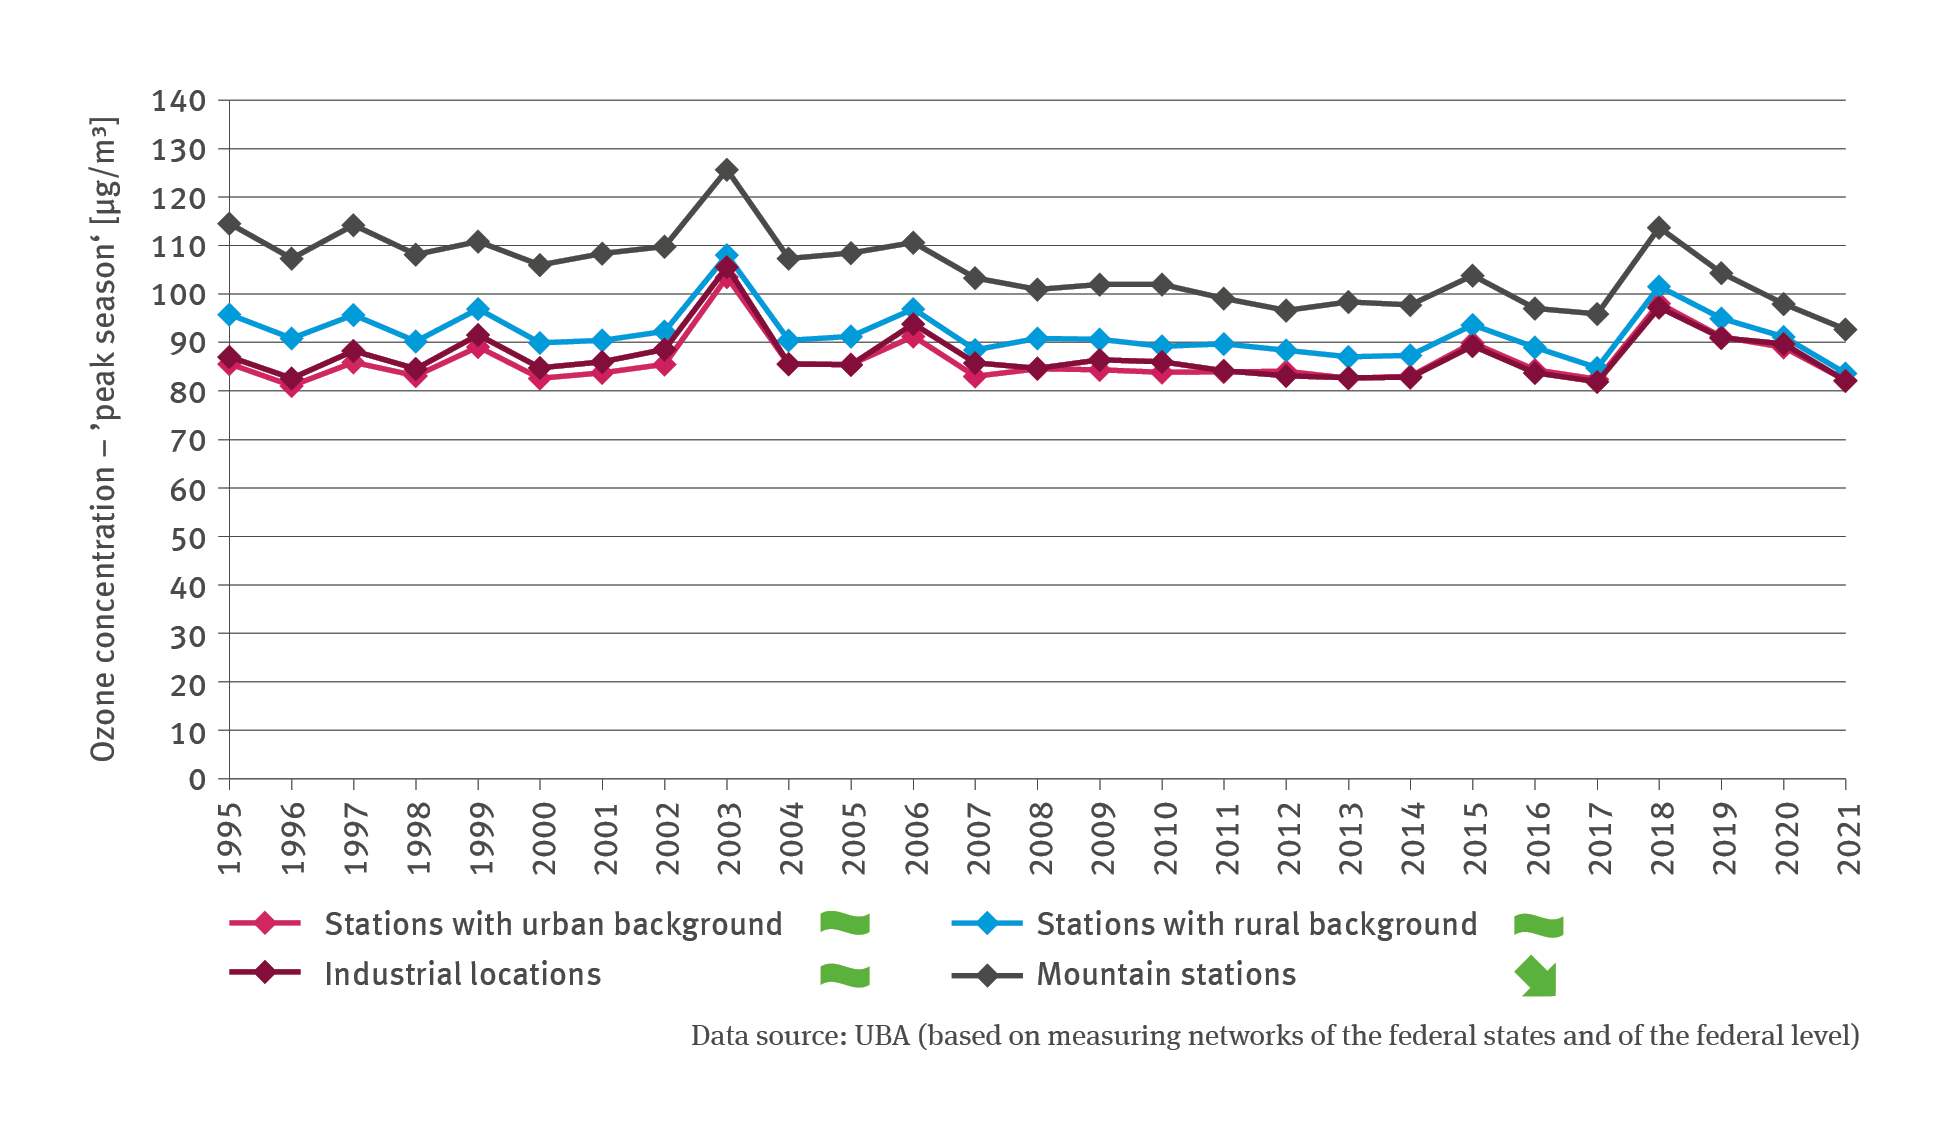
Source: UBA (based on measuring networks of the federal states and of the federal level)
Download image (139.09 kB)

The following contents contain this medium:

Short link: www.uba.de/m111406en