Data Search

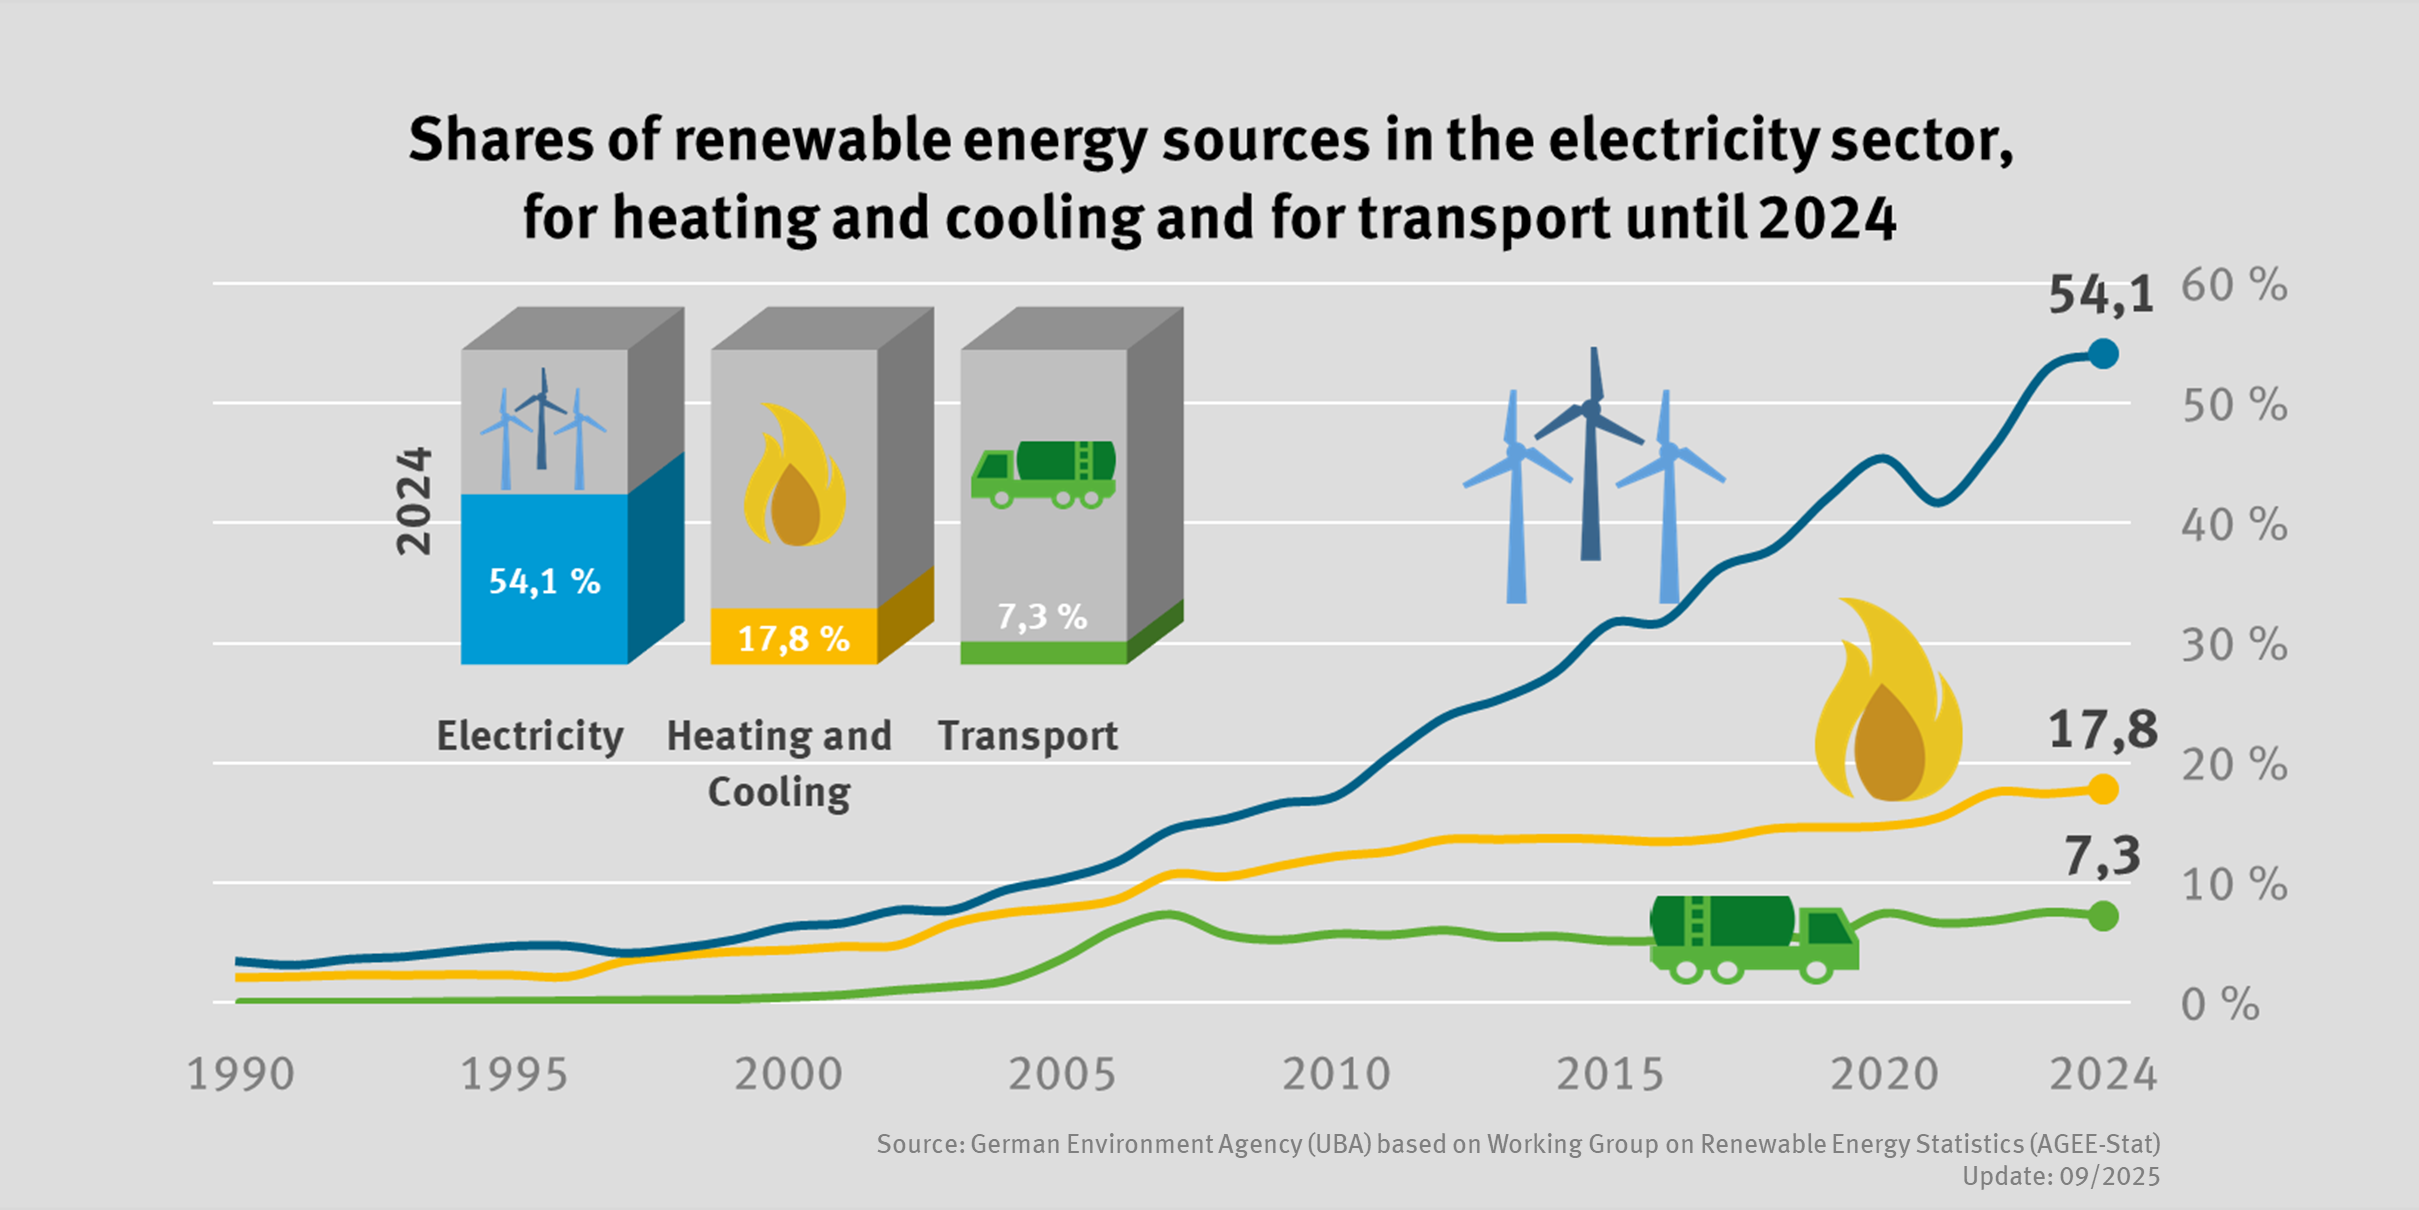
Time series for the development of renewable energy sources based on statistical data from the Working Group on Renewable Energy-Statistics (AGEE-Stat) in Germany (XLSX-file)
- Klima
- Energie
- Diagramme
- Infografiken
- Daten und Tabellen
Export data
Time series for the development of renewable energy sources based on statistical data from the Working Group on Renewable Energy-Statistics (AGEE-Stat) in Germany (PDF-file)
- Diagramme
- Infografiken
- Daten und Tabellen
Export data

Development of renewable energy shares for electricity, heat and transport
- Energie
- Infografiken
Export data

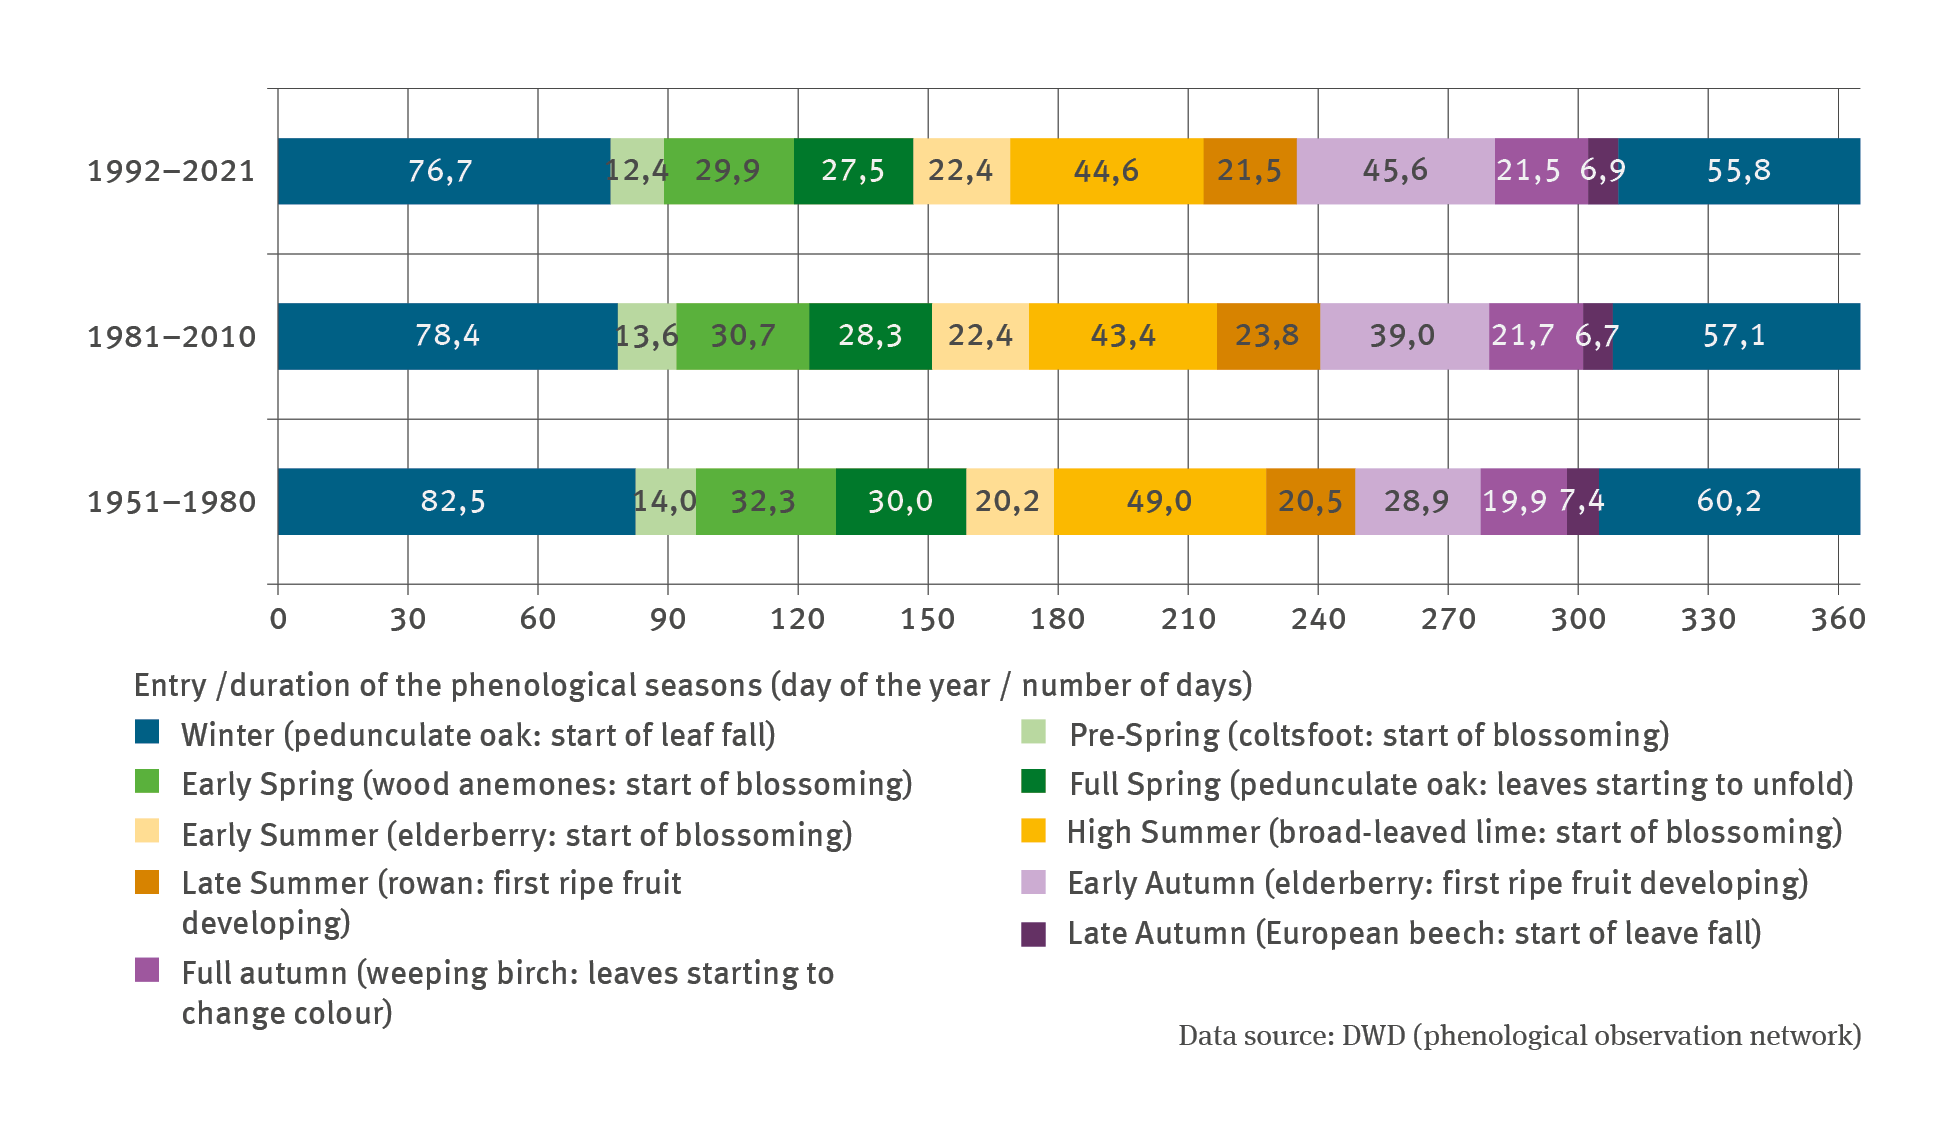
BD-I-1: Phenological changes in wild plant species
- Klima
- Fläche, Boden, Land-Ökosysteme
- Diagramme
- Infografiken
Export data
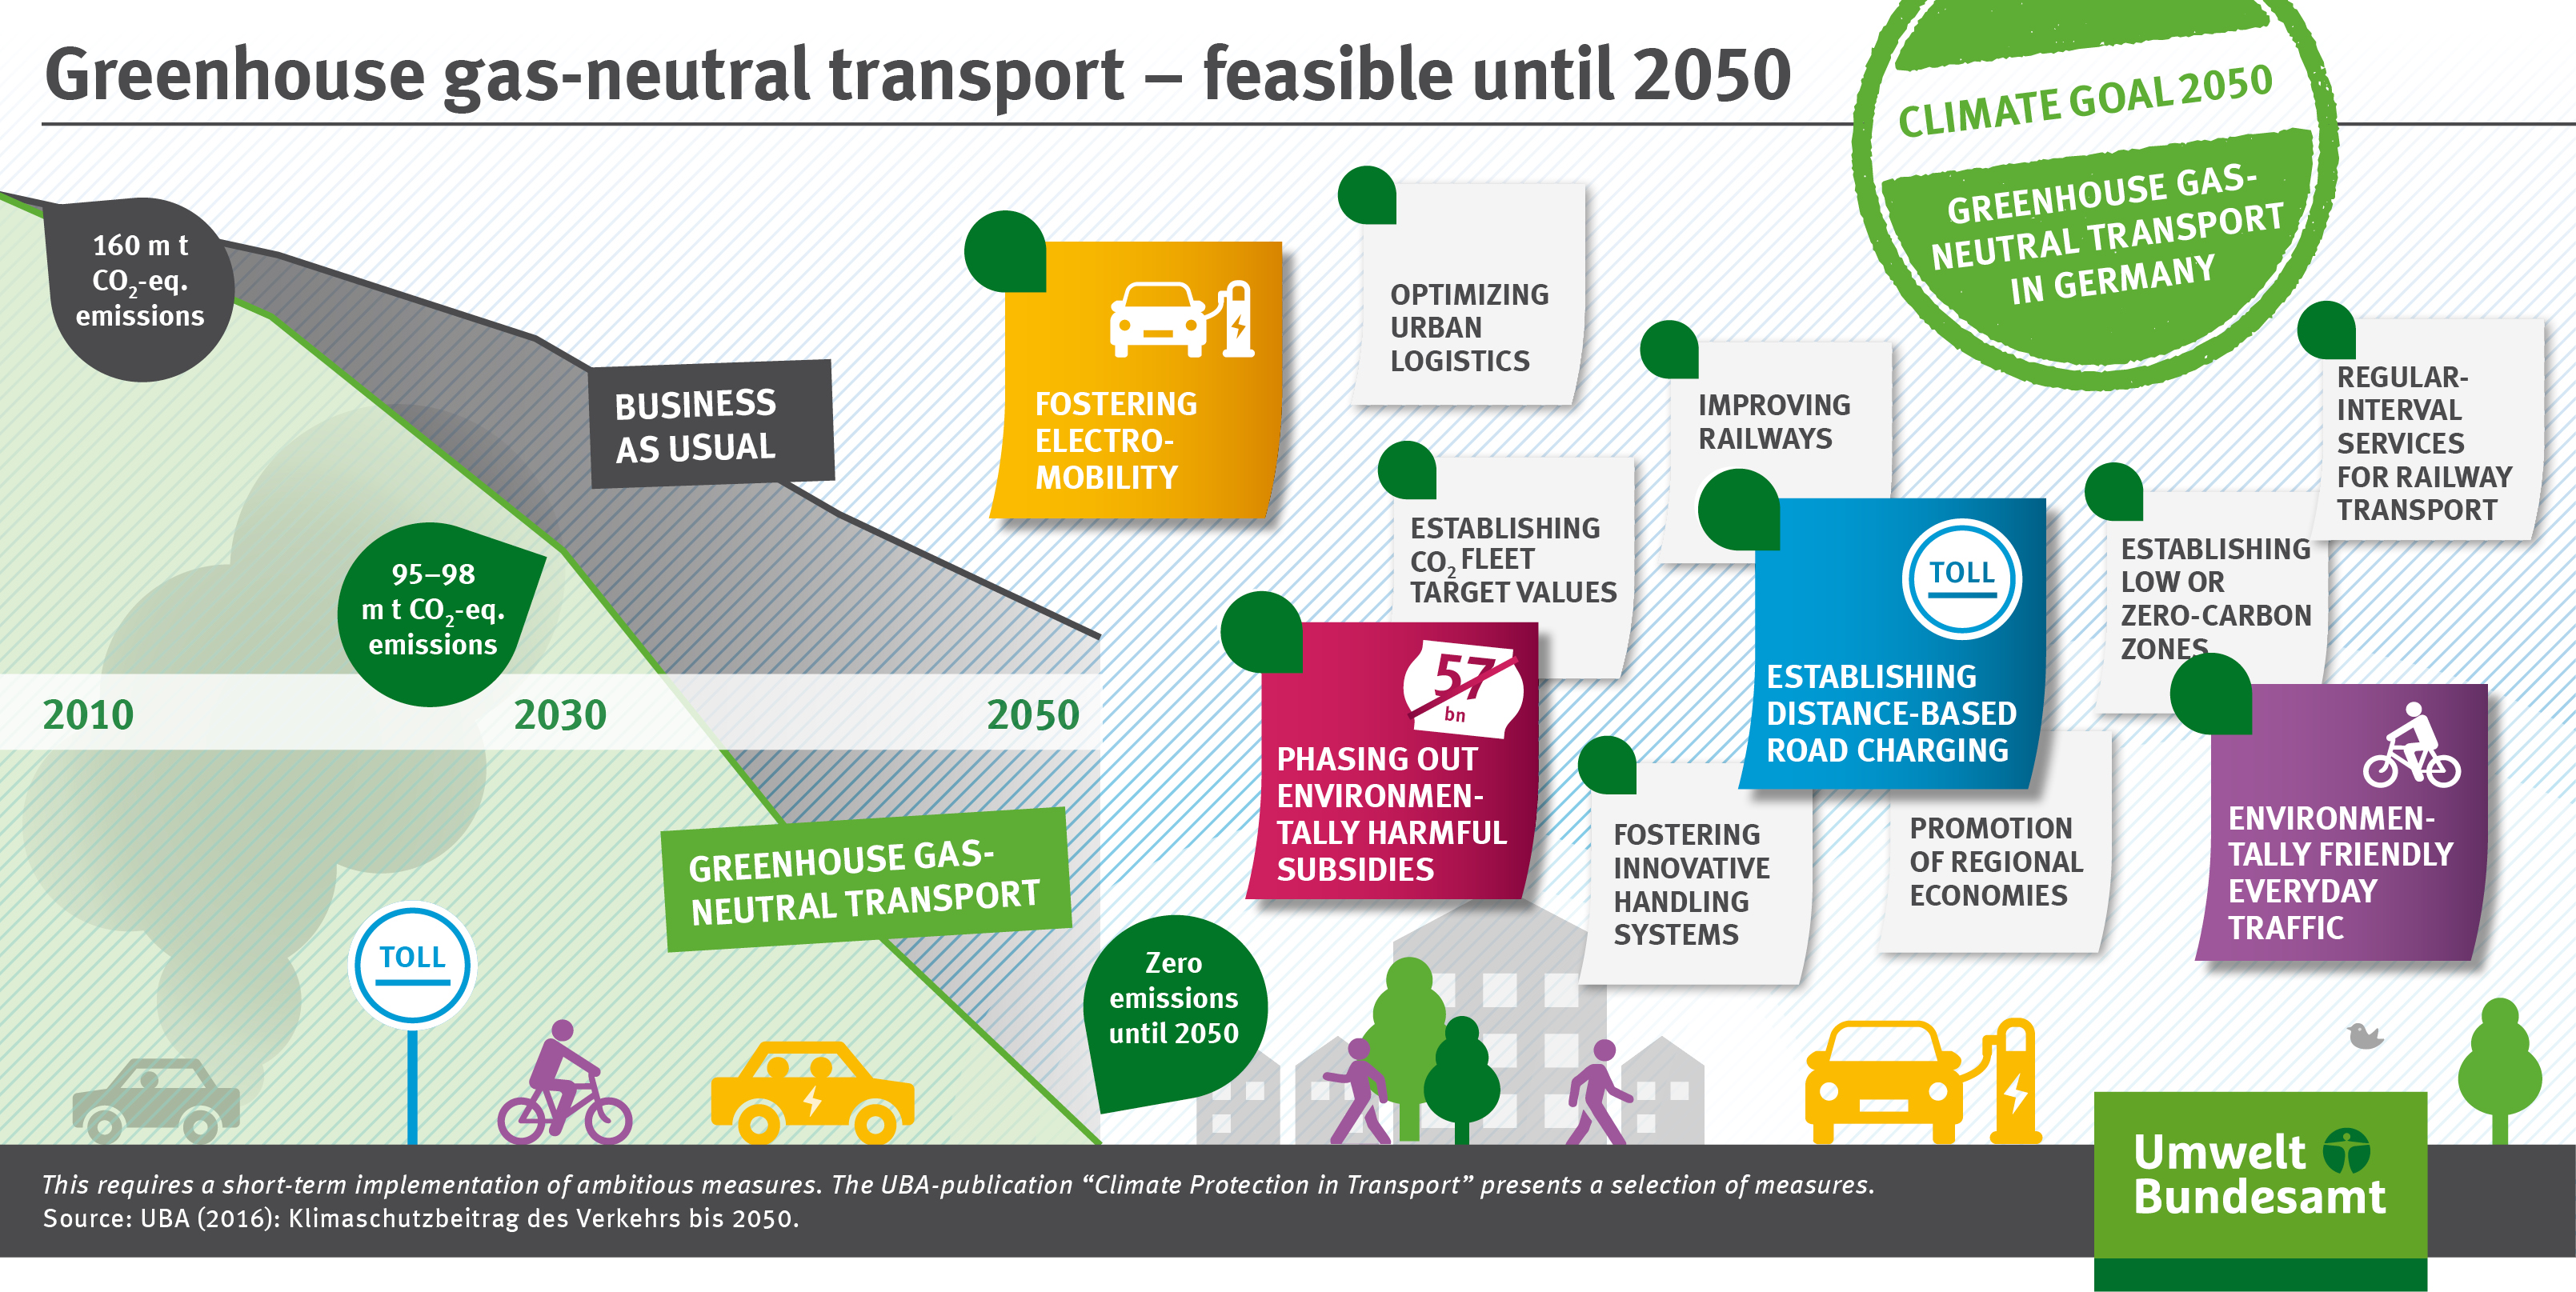
Infographic: Ambitious GHG mitigation opportunities and challenges in the agricultural sector
- Klima
- Land- und Forstwirtschaft
- Infografiken
Export data

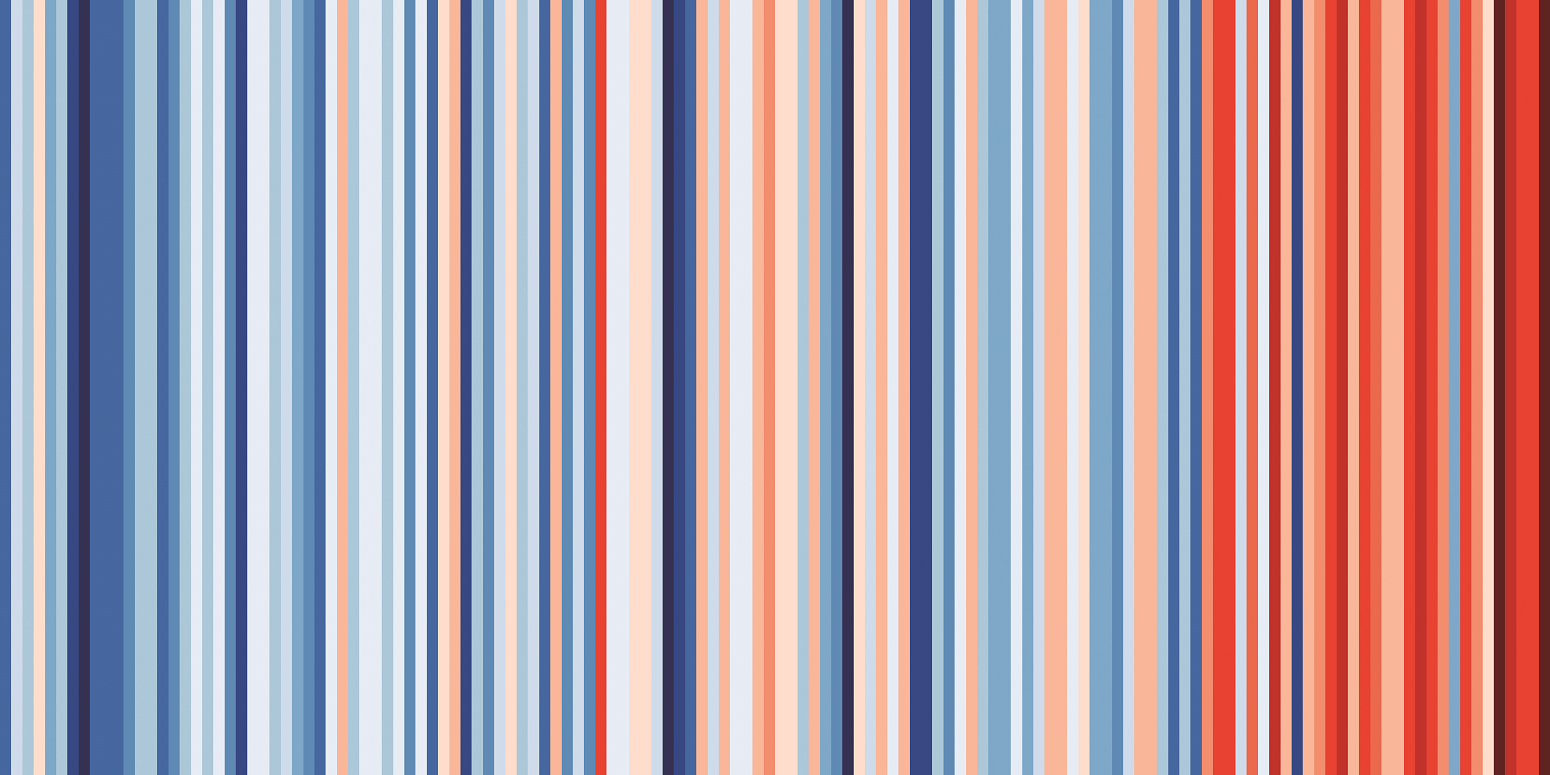
Figure 1: Chart of average temperature for Germany between 1881 and 2018
- Klima
- Infografiken
Export data


