Data Search

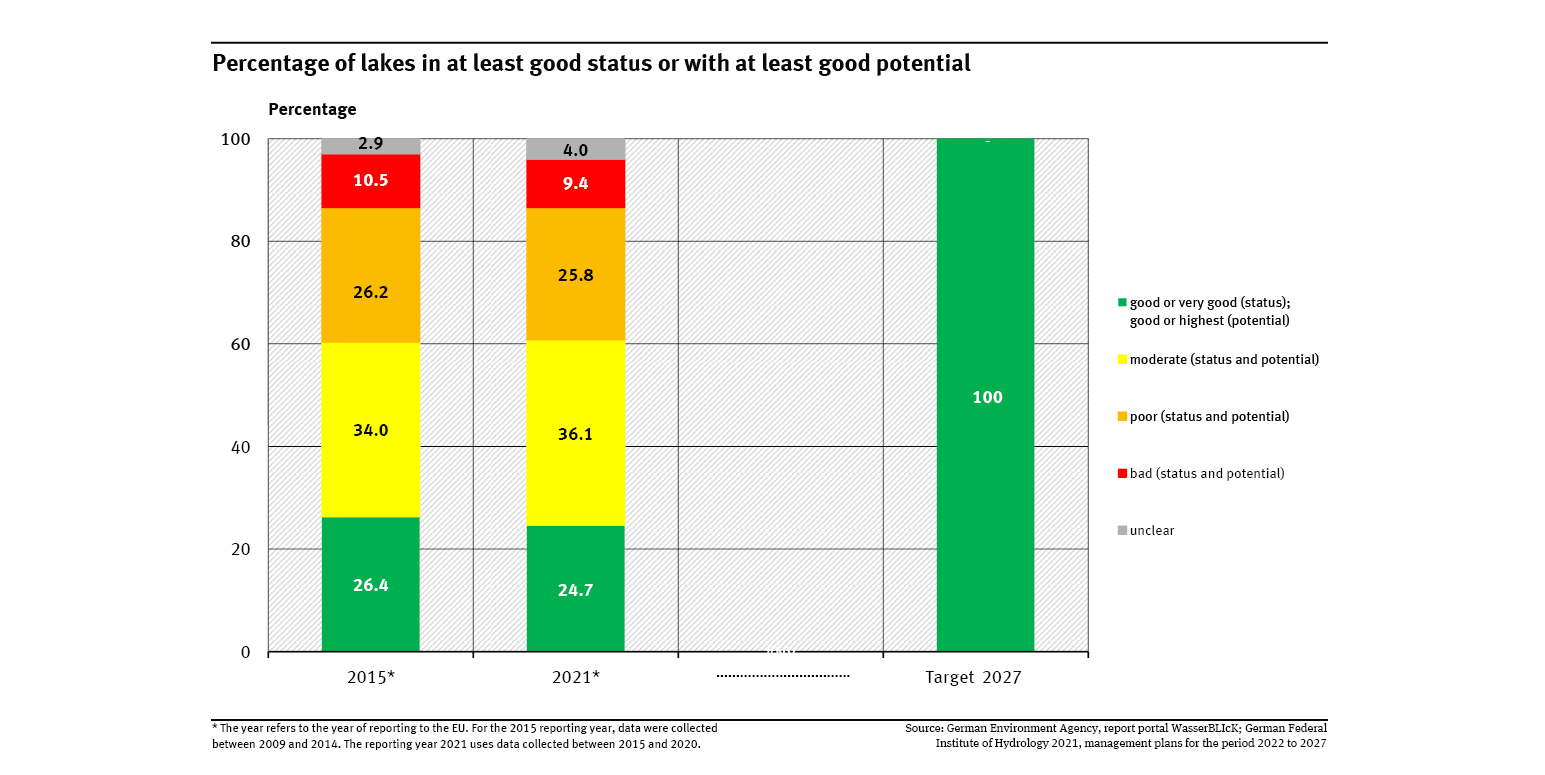
Percentage of lakes in at least good status or with at least a good potential
- Wasser
- Diagramme
- Umwelt-Indikatoren
- Daten und Tabellen

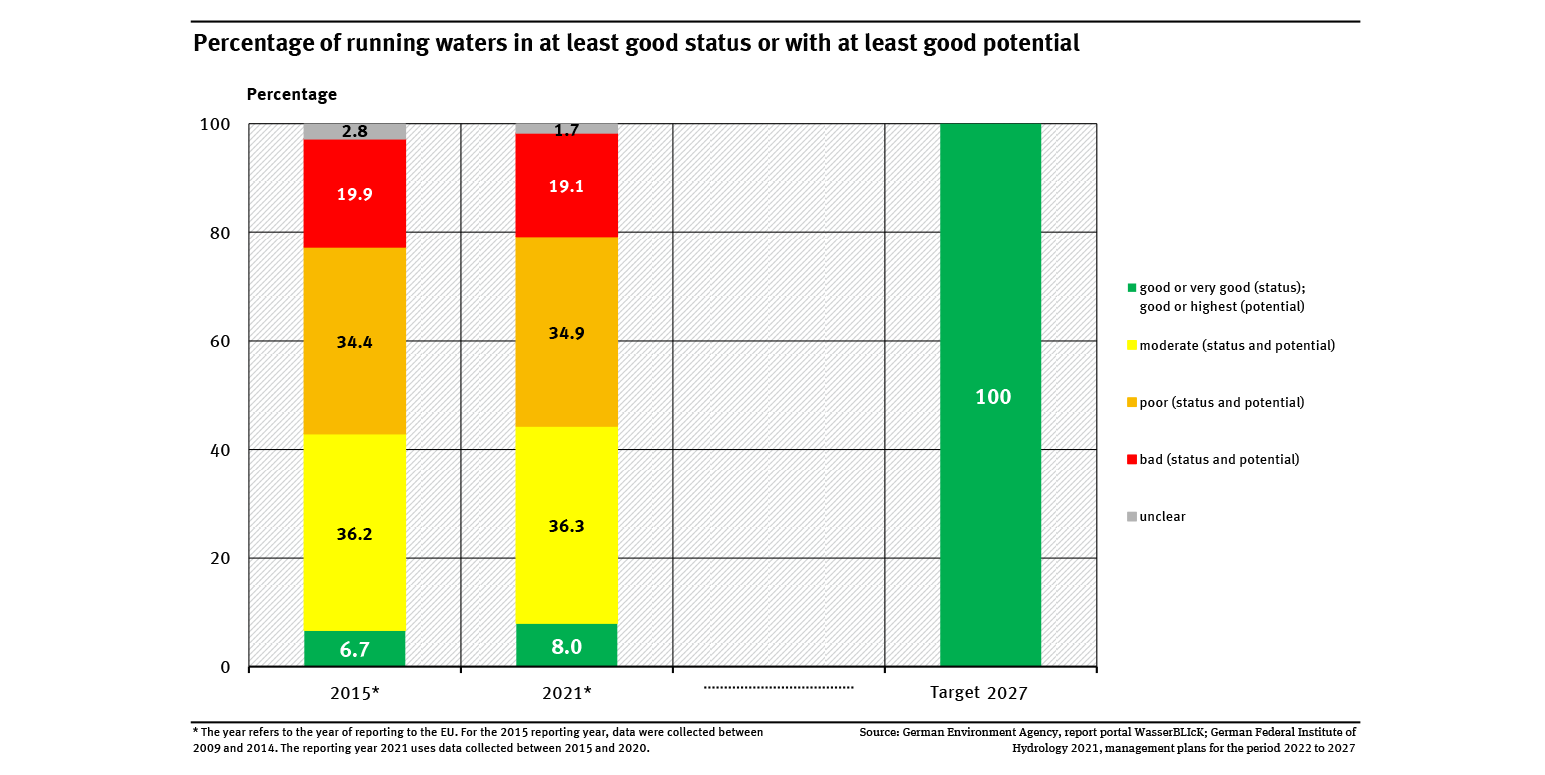
Percentage of running waters in at least good status or with at least a good potential
- Wasser
- Diagramme
- Umwelt-Indikatoren
- Daten und Tabellen

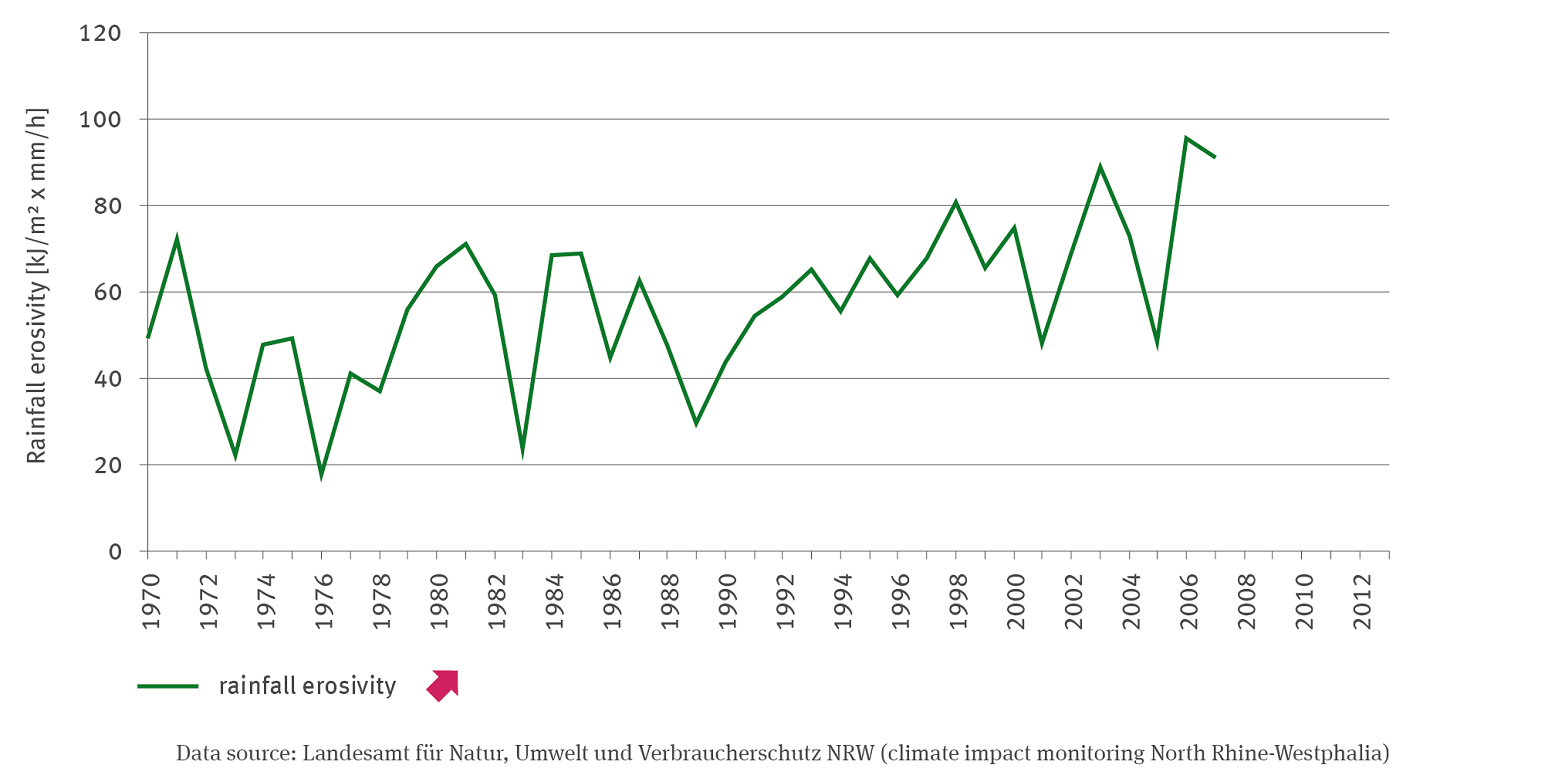
BO-I-2: Rainfall erosivity – case study
- Klima
- Fläche, Boden, Land-Ökosysteme
- Wasser
- Diagramme
Export data


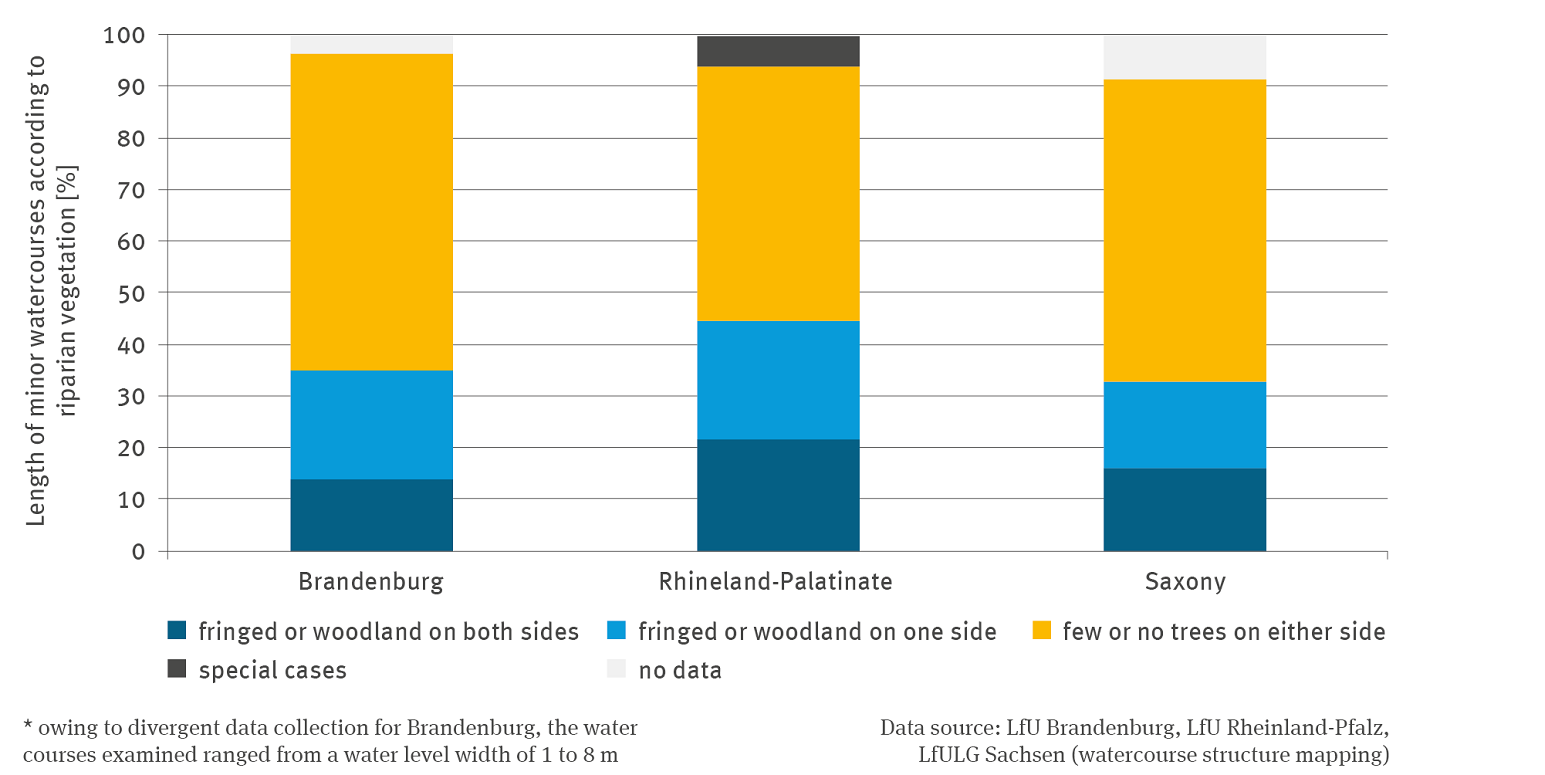
WW-R-3: Riparian vegetation on the banks of small and medium-sized watercourses – case study
- Klima
- Wasser
- Diagramme
Export data

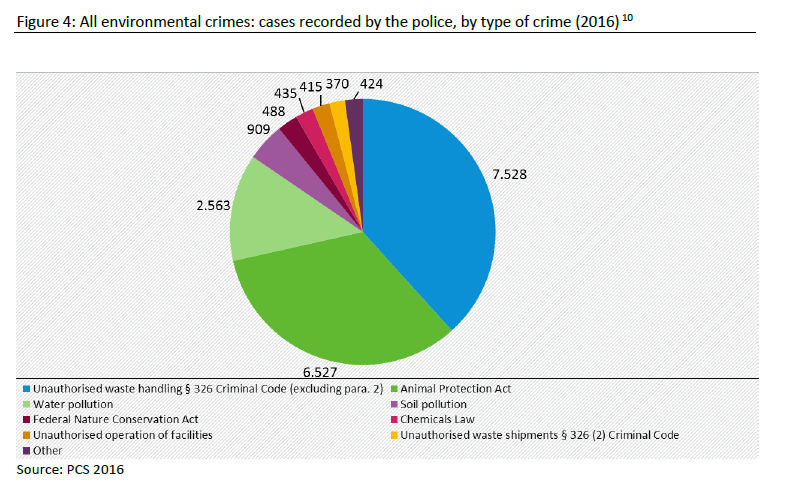
All environmental crimes: cases recorded by the police, by type of crime (2016)
- Wasser
- Ressourcen und Abfall
- Umwelt und Wirtschaft
- Diagramme
- Daten und Tabellen
Export data