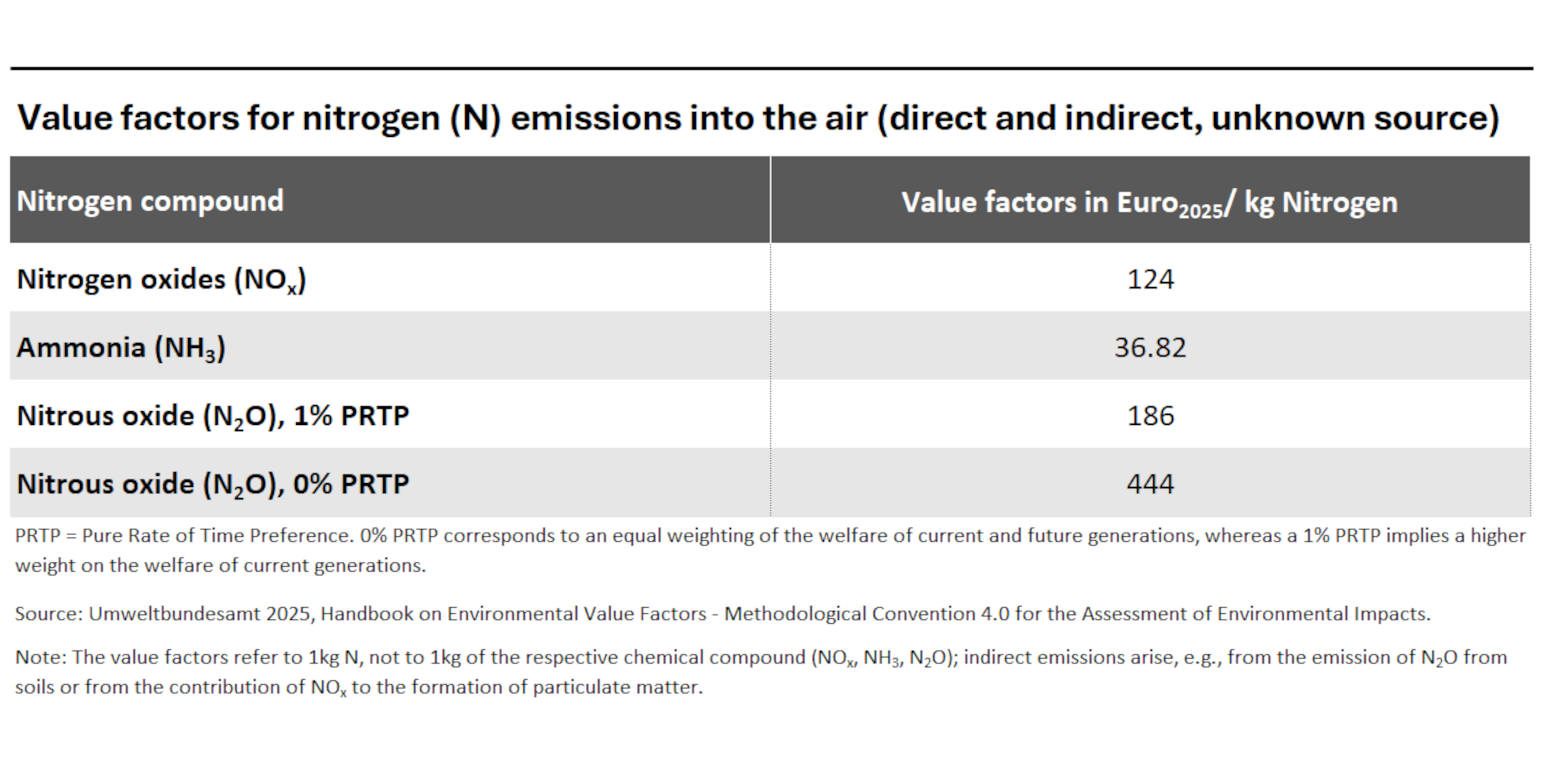
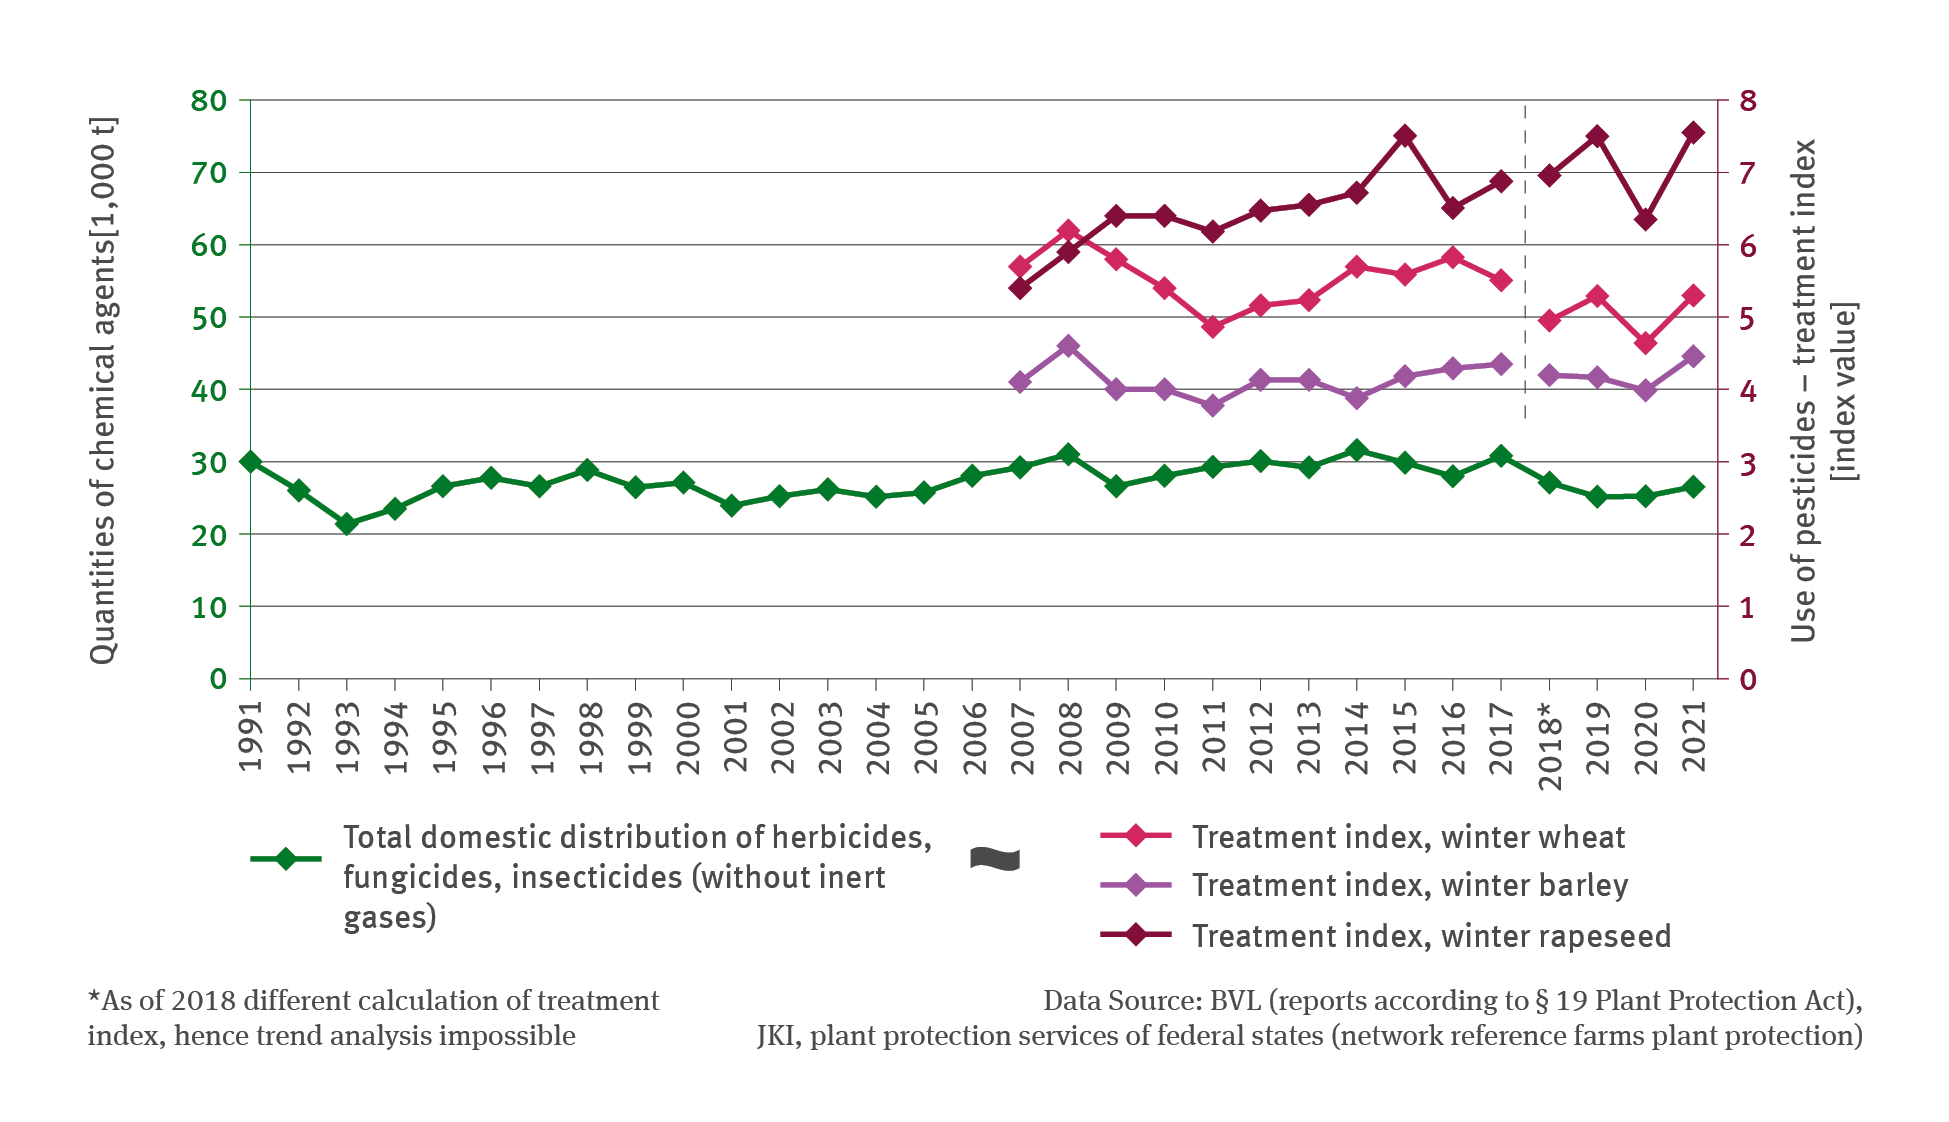
Skip to main content Skip to main menu Skip to footer

Data Search

Data Search

Here you will find diagrams, infographics, maps and tables for direct download.

Data Search

A graph shows the increase of the share of organic farming areas in total utilised agricultural area based on data of the German Federal Statistical Office and the BMLEH. It also shows the 30 percent target of the Federal Government.

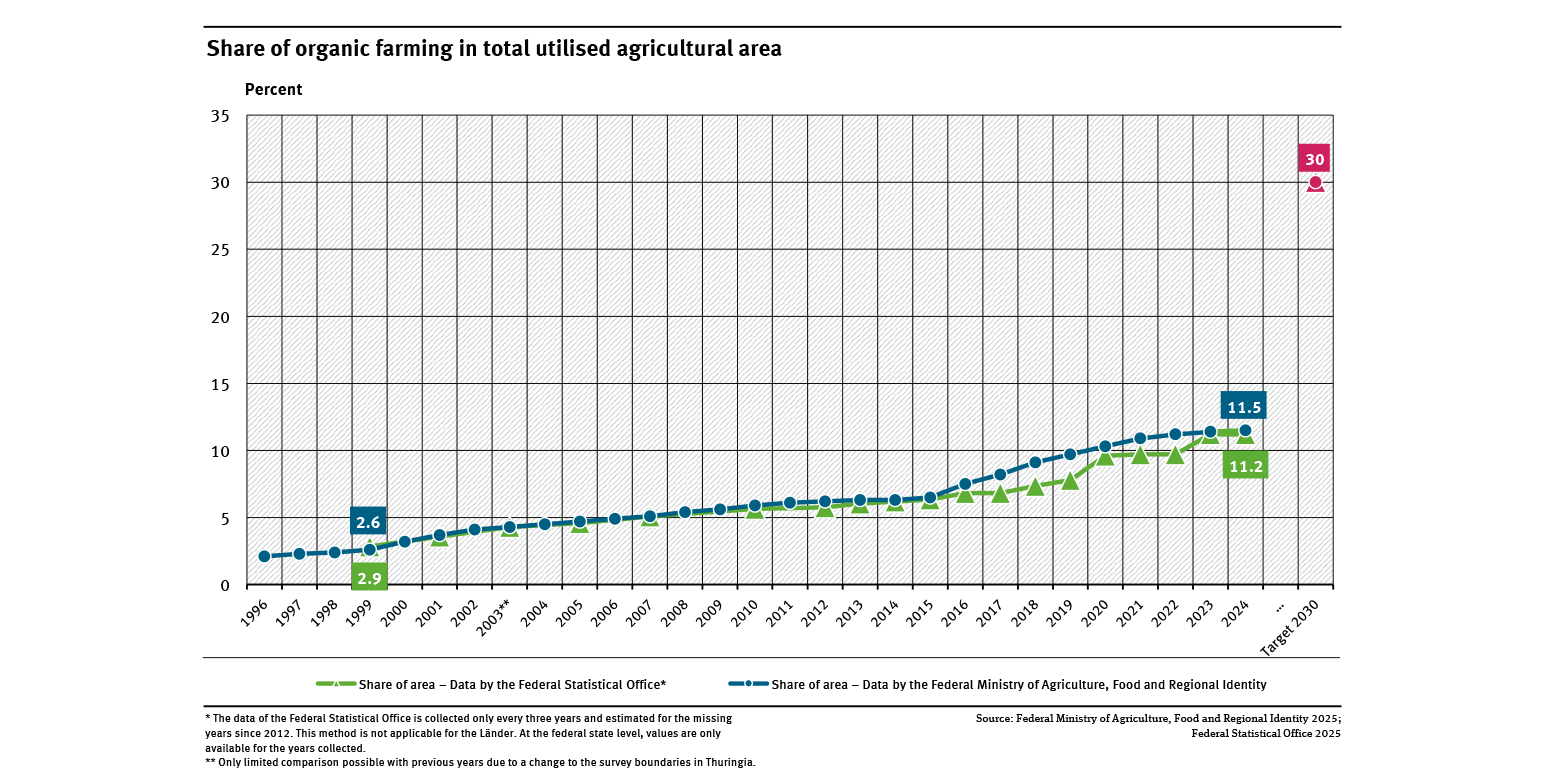
Share of organic farming in total utilised agricultural area

  • Land- und Forstwirtschaft
  • Diagramme
  • Umwelt-Indikatoren
  • Daten und Tabellen
Export data
A graph shows the percentage of woodland area certified under the PEFC or FSC sustainability standards from 2000 to 2024. In 2024, the PEFC covered 79.3 percent and the FSC 10.9 percent. The graph also shows the target for 2010.

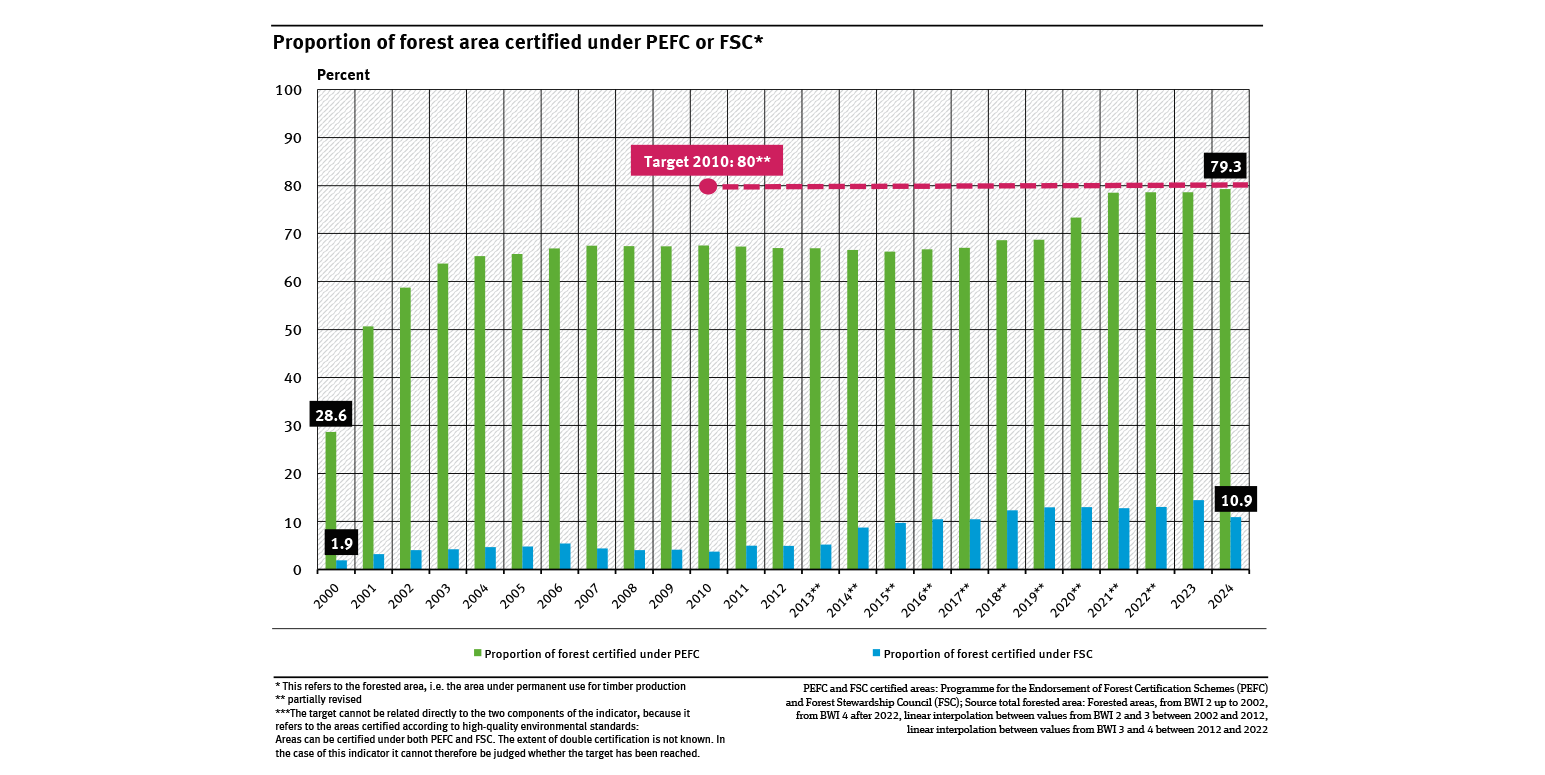
Proportion of forest area certified under PEFC or FSC

  • Land- und Forstwirtschaft
  • Diagramme
  • Umwelt-Indikatoren
  • Daten und Tabellen
Export data
A graph shows the area of permanent grassland and its share of the total agricultural area from 1991 to 2024. Both indicators have been declining until 2013 and have then increased in the years that followed. Most recently, the values have stagnated.

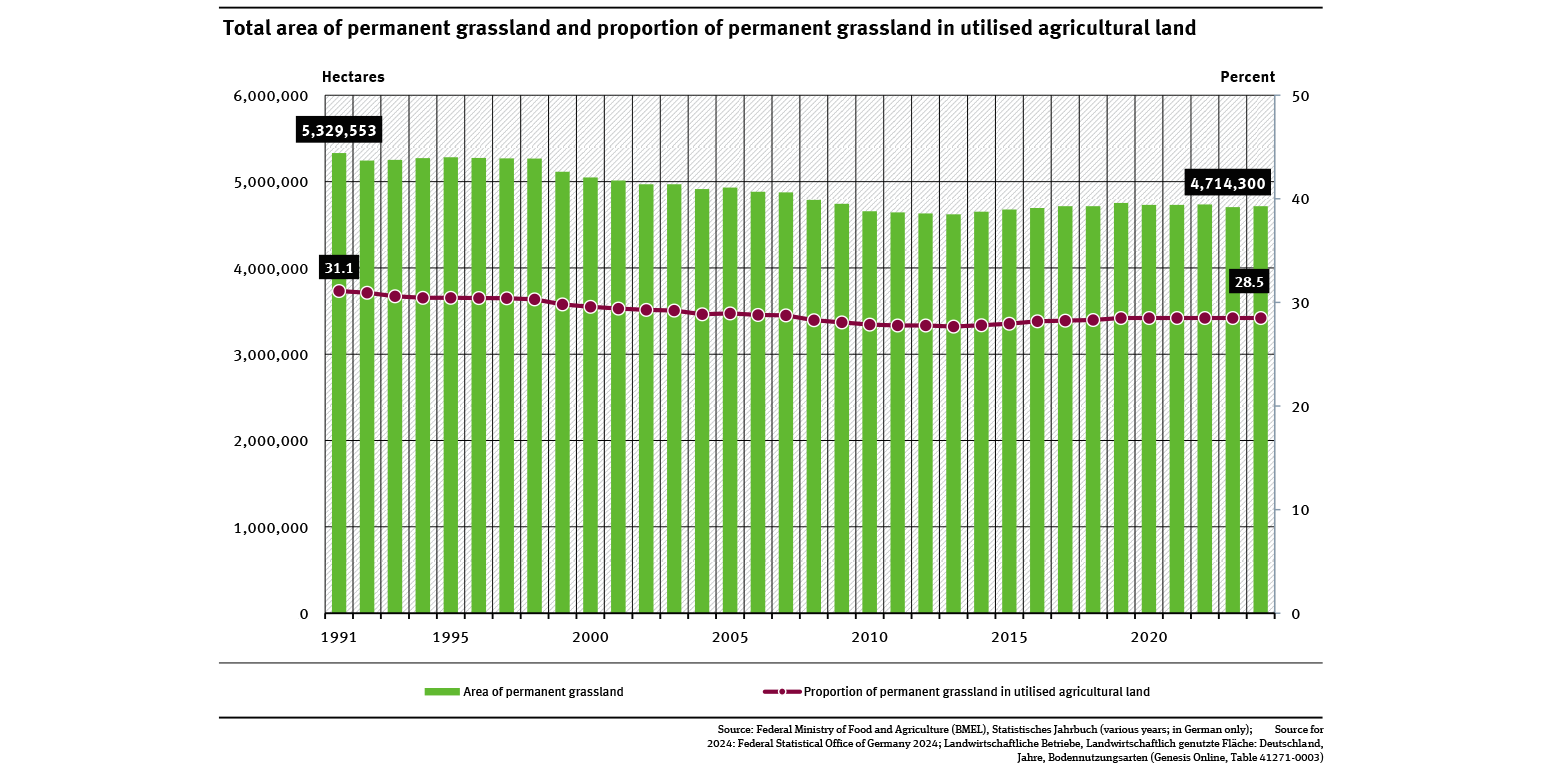
Total area of permanent grassland and proportion of permanent grassland ...

  • Land- und Forstwirtschaft
  • Diagramme
  • Umwelt-Indikatoren
  • Daten und Tabellen
Export data
The illustration HUE-5 ’International finance for climate adaptation (from budgetary funds’ contains a biaxial chart. Two lines illustrate – for the period from 2010 to 2021 – the development of German climate finance from budgetary funds in total as well as the proportion from this used for adaptation-relevant projects. Both lines indicate a significantly rising trend. In 2021 the German climate finance amounted to 5.34 billion Euros, 2.59 billion of which went towards adaptation-relevant projects.

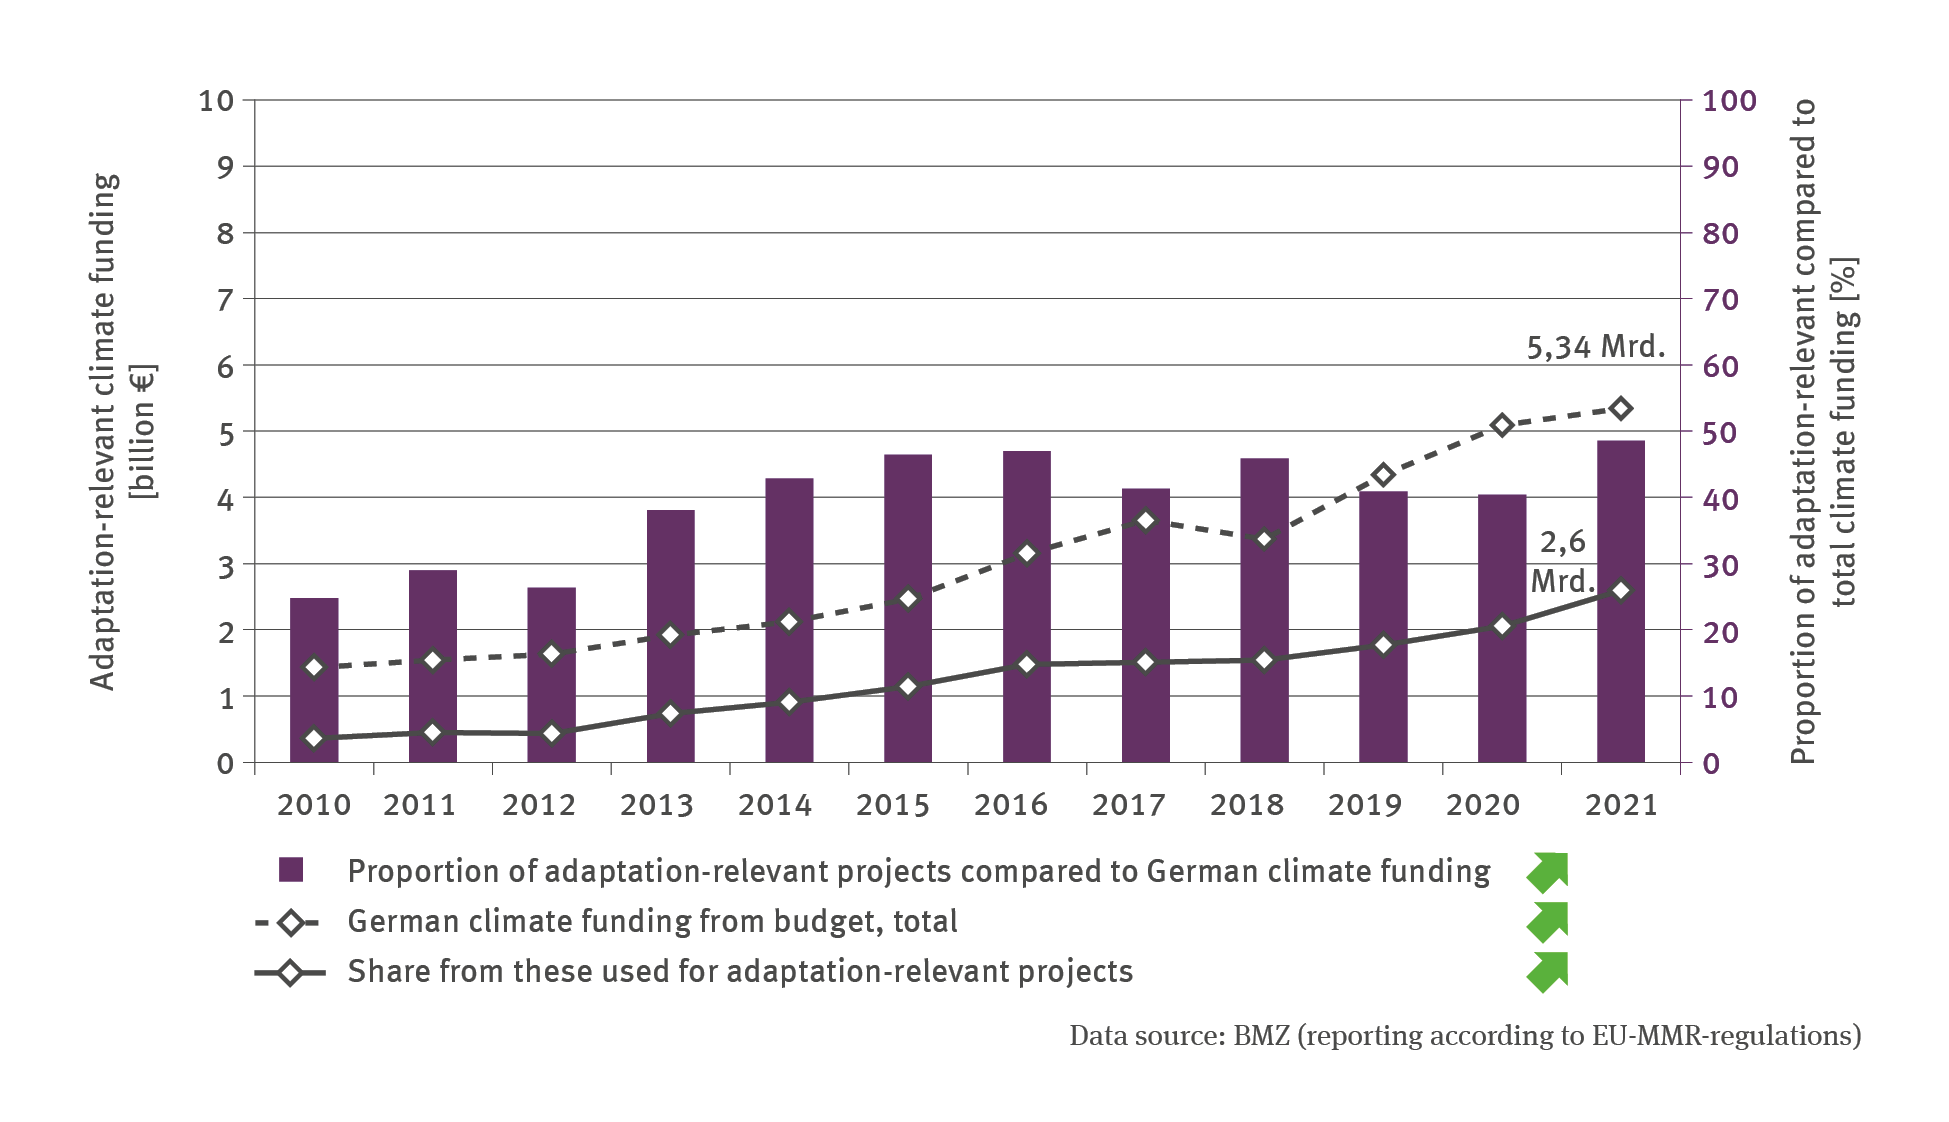
HUE-5: International finance for climate adaptation (from budgetary funds)

  • Klima
  • Land- und Forstwirtschaft
  • Diagramme
Export data
PNG
The bar chart FW-R-6 ’Silvicultural information on the subject of adaptation’ indicates the number of articles on the subject of climate change in the forestry journal ’AFZ – Der Wald’ published between 2002 and 2021. The time series shows a significant increase, especially between 2015 and 2019. Since that time, the number of annually published articles has stagnated at a level of roughly 65.

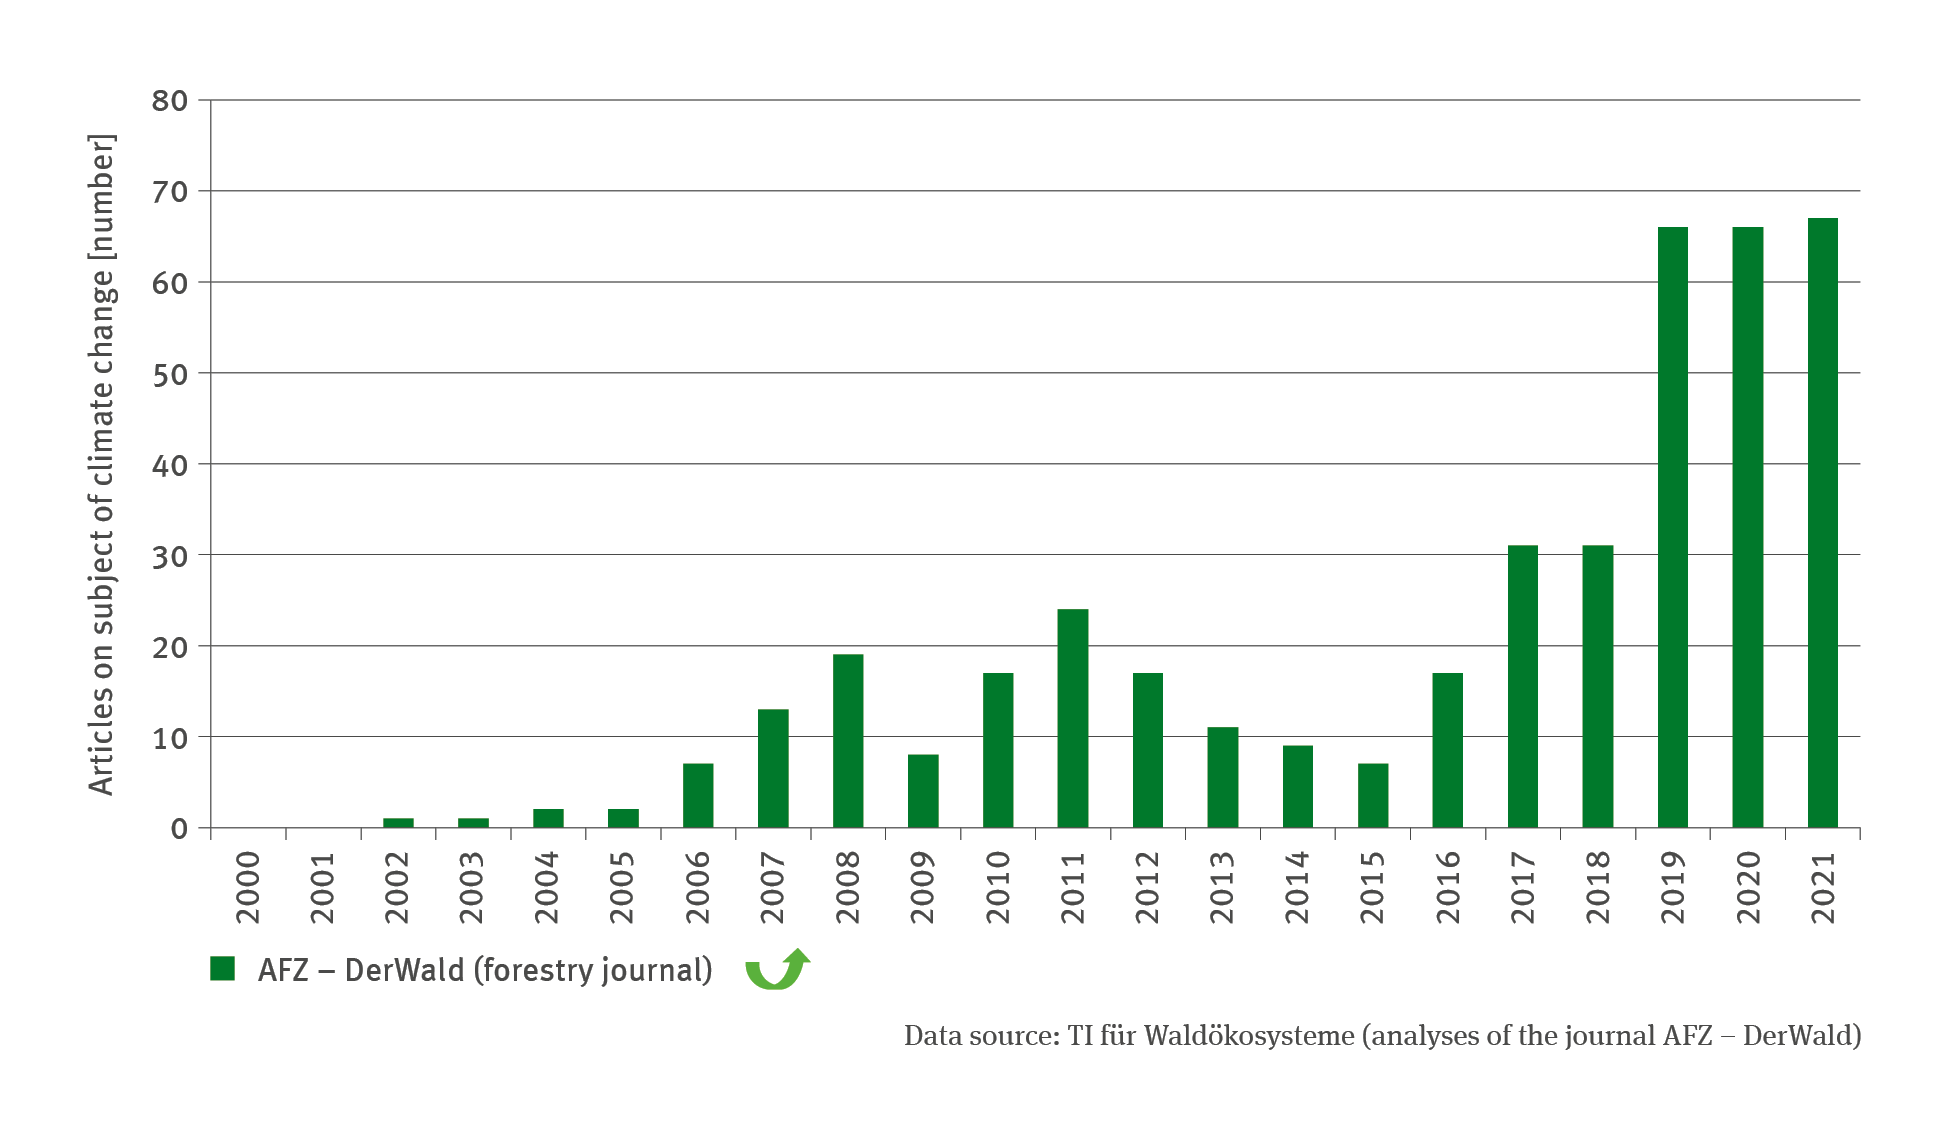
FW-R-6: Silvicultural information on the theme of adaptation

  • Klima
  • Land- und Forstwirtschaft
  • Diagramme
Export data
PNG
The biaxial chart FW-R-4 ’Utilisation of raw timber’ is divided into two thematic components. The upper part of the chart shows data on the utilisation of raw coniferous timber, whereas the lower part shows data on the utilisation of raw deciduous timber. The proportion of each type of subsequent utilisation compared to the total volume is indicated in stacked columns: material objects, energy production, exports, increase in storage.

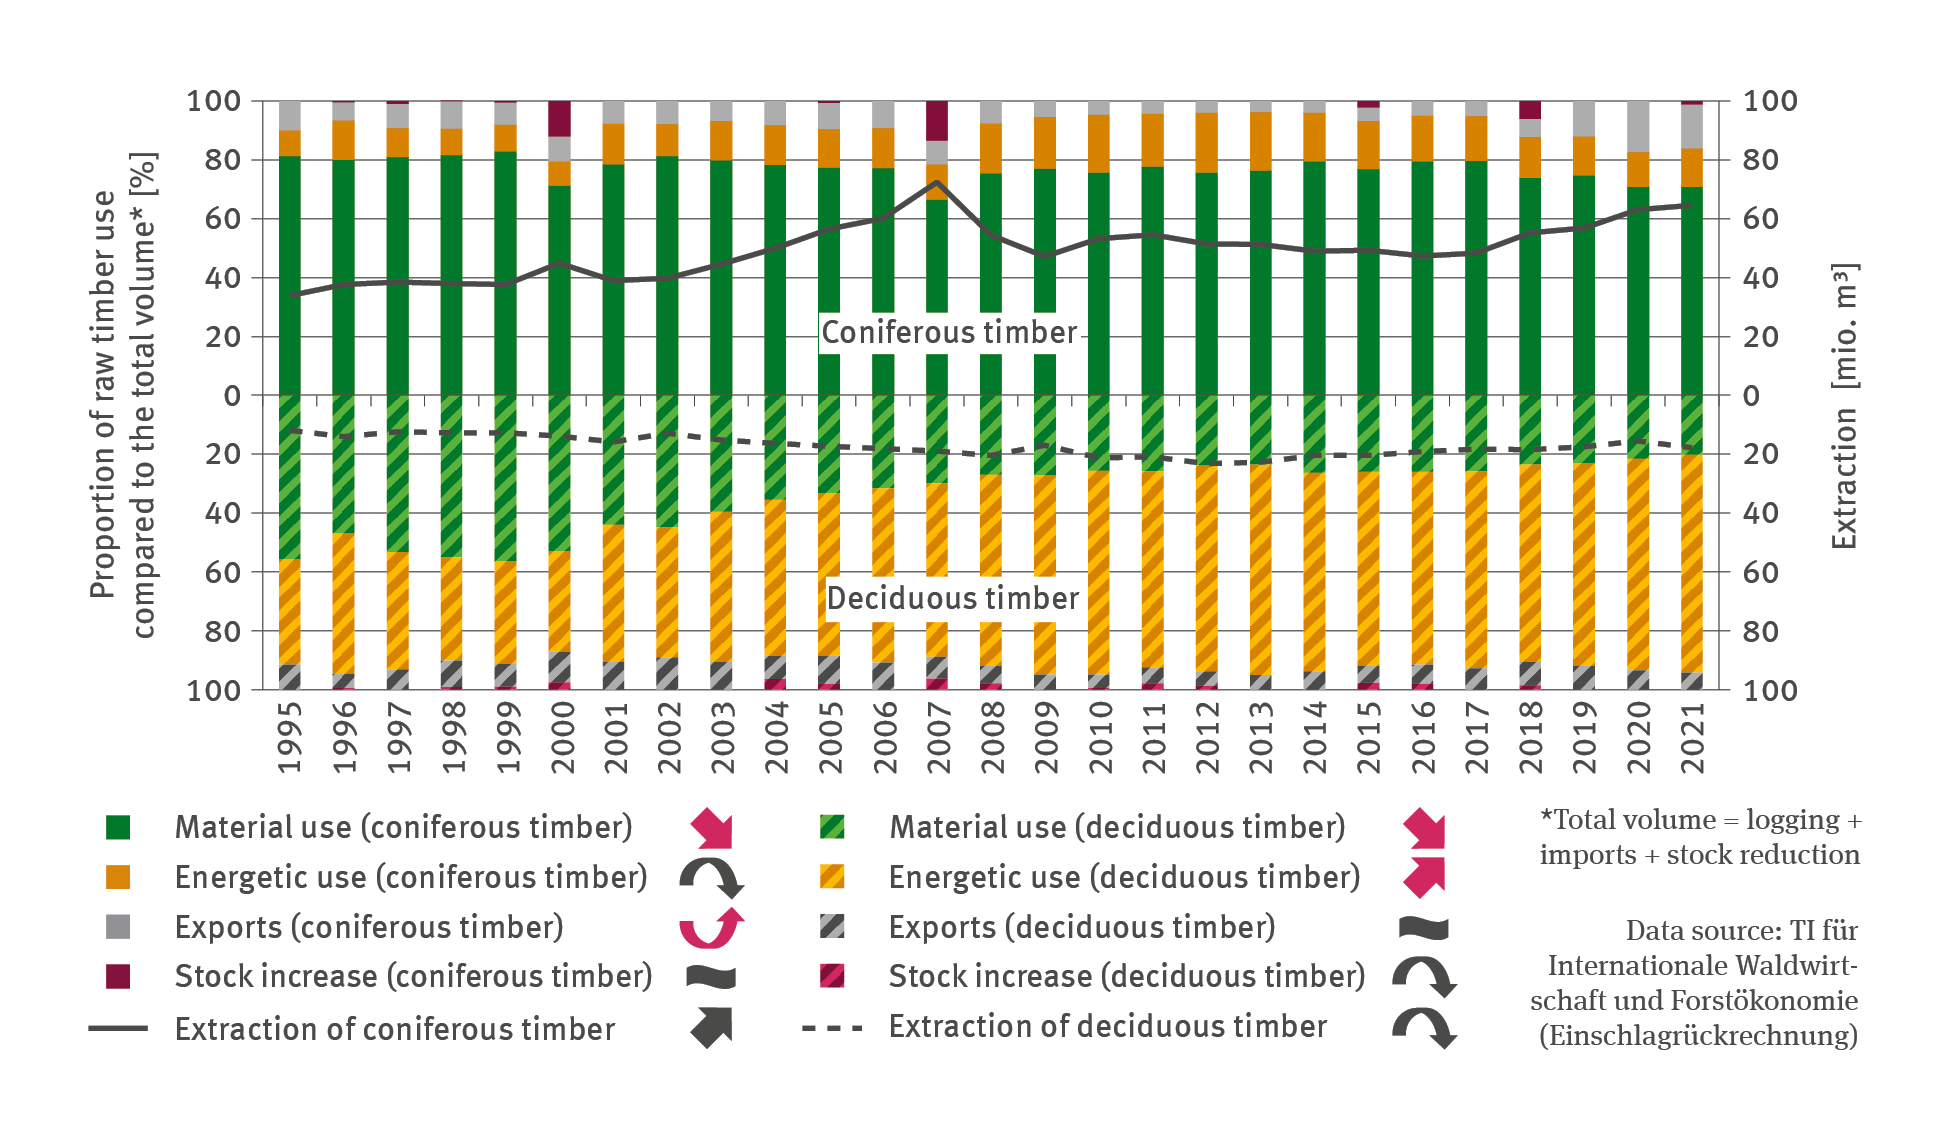
FW-R-4: Utilisation of raw timber

  • Klima
  • Fläche, Boden, Land-Ökosysteme
  • Land- und Forstwirtschaft
  • Diagramme
Export data
PNG
The bar chart illustrates the irrigatable terrain and the relevant proportion of actually irrigated terrain in thousand hectares for the years of 2009, 2012, 2015 and 2019. In 2019 the irrigatable terrain reached its highest value with just under 800,000 hectares. The proportion of terrain actually irrigated in the same year was also the highest to date. It amounted 500,000 hectares.

LW-R-6: Agricultural irrigation

  • Klima
  • Land- und Forstwirtschaft
  • Diagramme
Export data
PNG
The illustration FW-R-3 ’Humus reserves in forest soils’ indicates – for the period of 1992 to 2021 – in the shape of a line chart, the annual reserves of organic carbon in forest soils in tonnes per hectare. During the observation period, carbon reserves increased continuously and significantly from roughly 75 tonnes per hectare to 85 tonnes per hectare.

FW-R-3: Humus reserves in forest soils

  • Klima
  • Land- und Forstwirtschaft
  • Diagramme
Export data
PNG
The line chart contains a biaxial chart indicating the total domestic sale of herbicides, fungicides, insecticides (without inert gases) for the period of 1991 to 2021 in volumes of active ingredients in units of a thousand tonnes.

LW-R-5: Sales and application of pesticides

  • Klima
  • Land- und Forstwirtschaft
  • Diagramme
Export data
PNG
The bar chart FW-R-2 ‘Conservation of forest-genetic resources’ indicates the terrain of stands dedicated to the purpose of genetic conservation on the natural site (in-situ) of the occurrence of species and of stands and seed plantations cultivated for the purpose of genetic conservation outside their natural occurrence (ex-situ) in the years of 2004, 2010, 2012, 2017 and 2022 respectively. In the period of 2004 to 2010, the total terrain of in-situ stands increased to roughly 32,000 hectares.

FW-R-2: Conservation of forest-genetic resources

  • Klima
  • Land- und Forstwirtschaft
  • Diagramme
Export data
PNG

You can also search in other data portals of the German Environment Agency

Short link: www.umweltbundesamt.de/n300701en