Data Search


TOU-I-6: Seasonal bed nights in German tourist areas
- Klima
- Private Haushalte und Konsum
- Diagramme
Export data


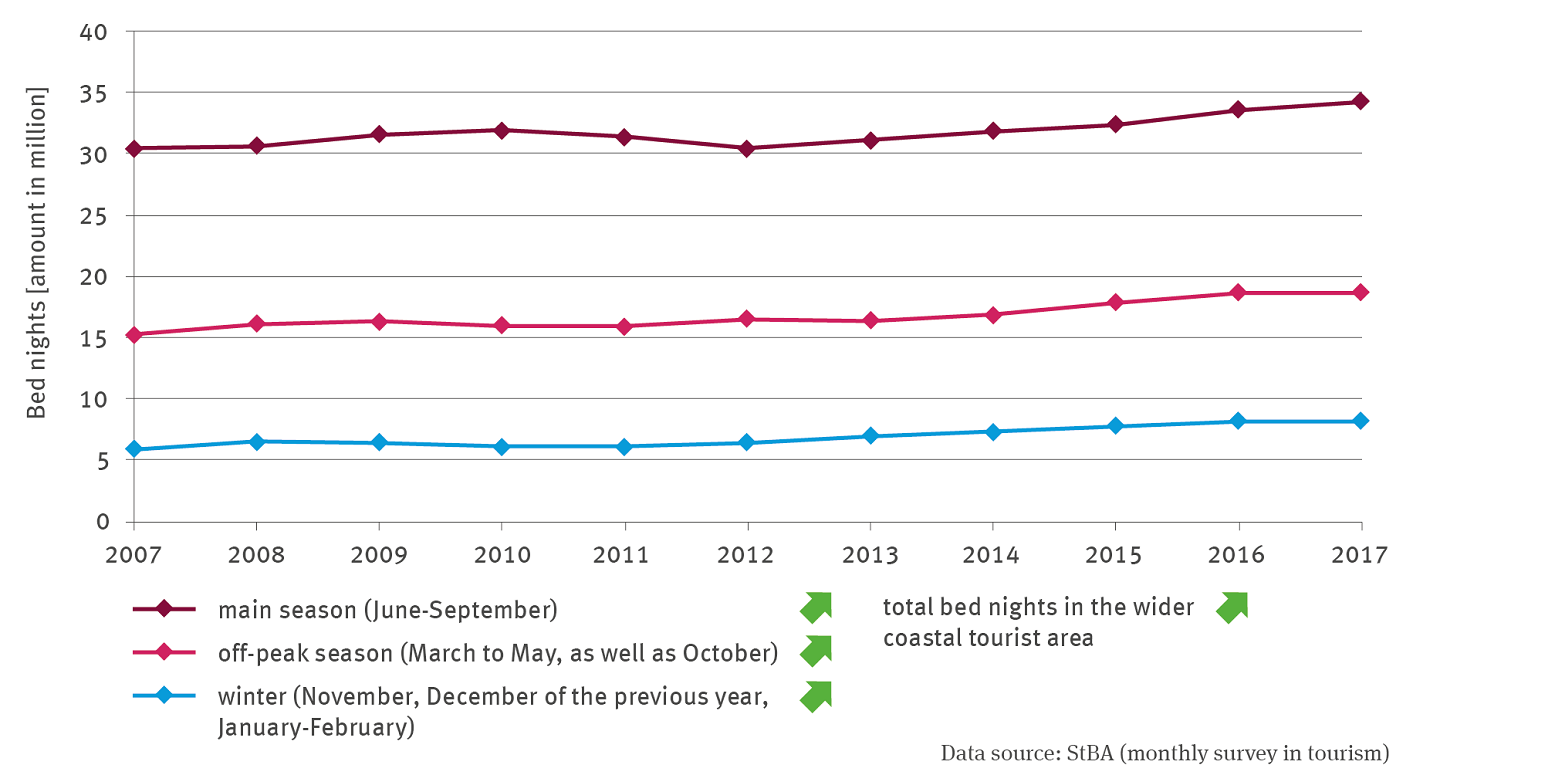
TOU-I-2: Bed nights in coastal tourist areas
- Klima
- Private Haushalte und Konsum
- Diagramme
Export data


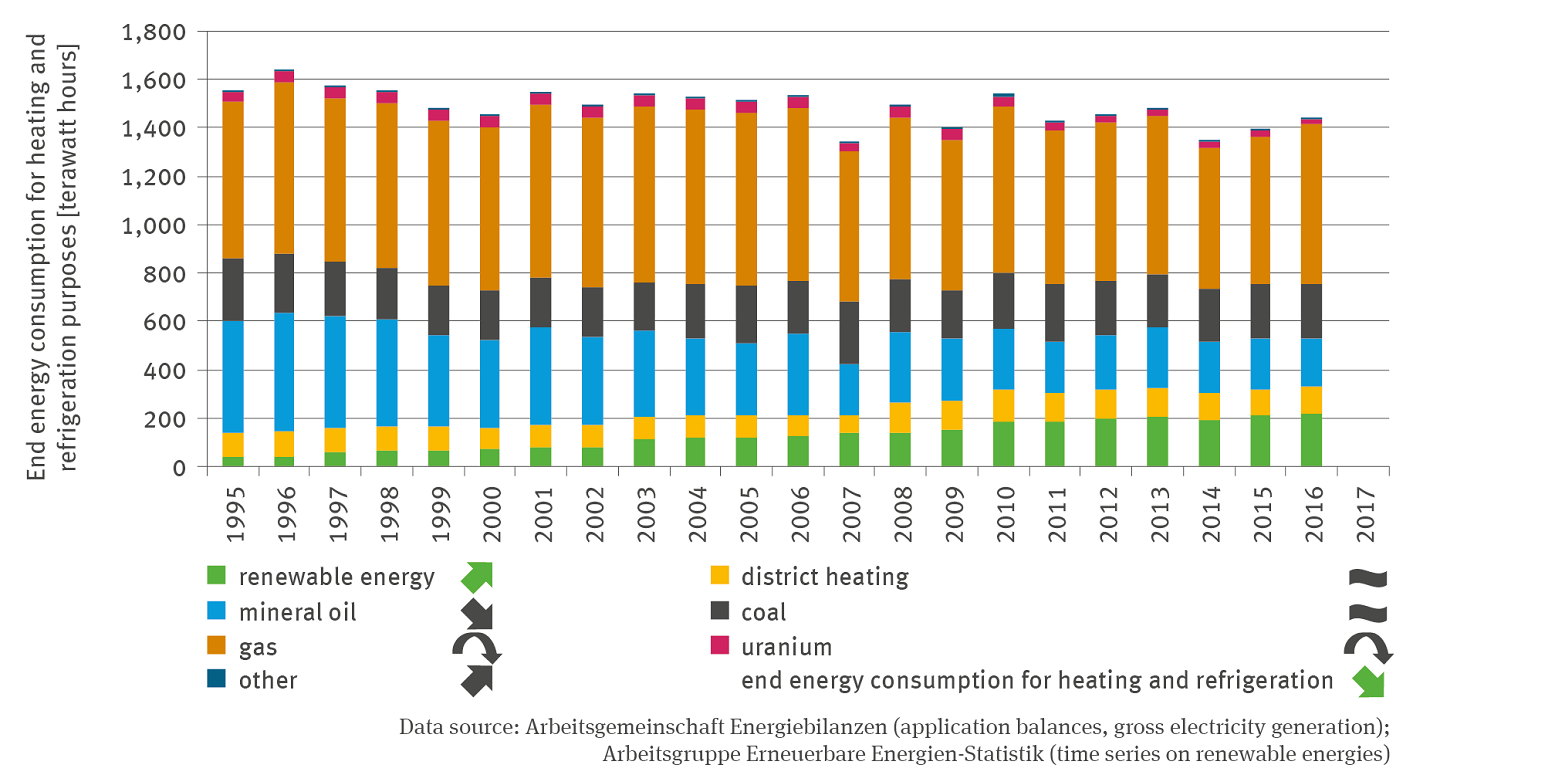
EW-R-2: Diversification of end energy consumption for heating and refrigeration
- Klima
- Energie
- Diagramme
Export data


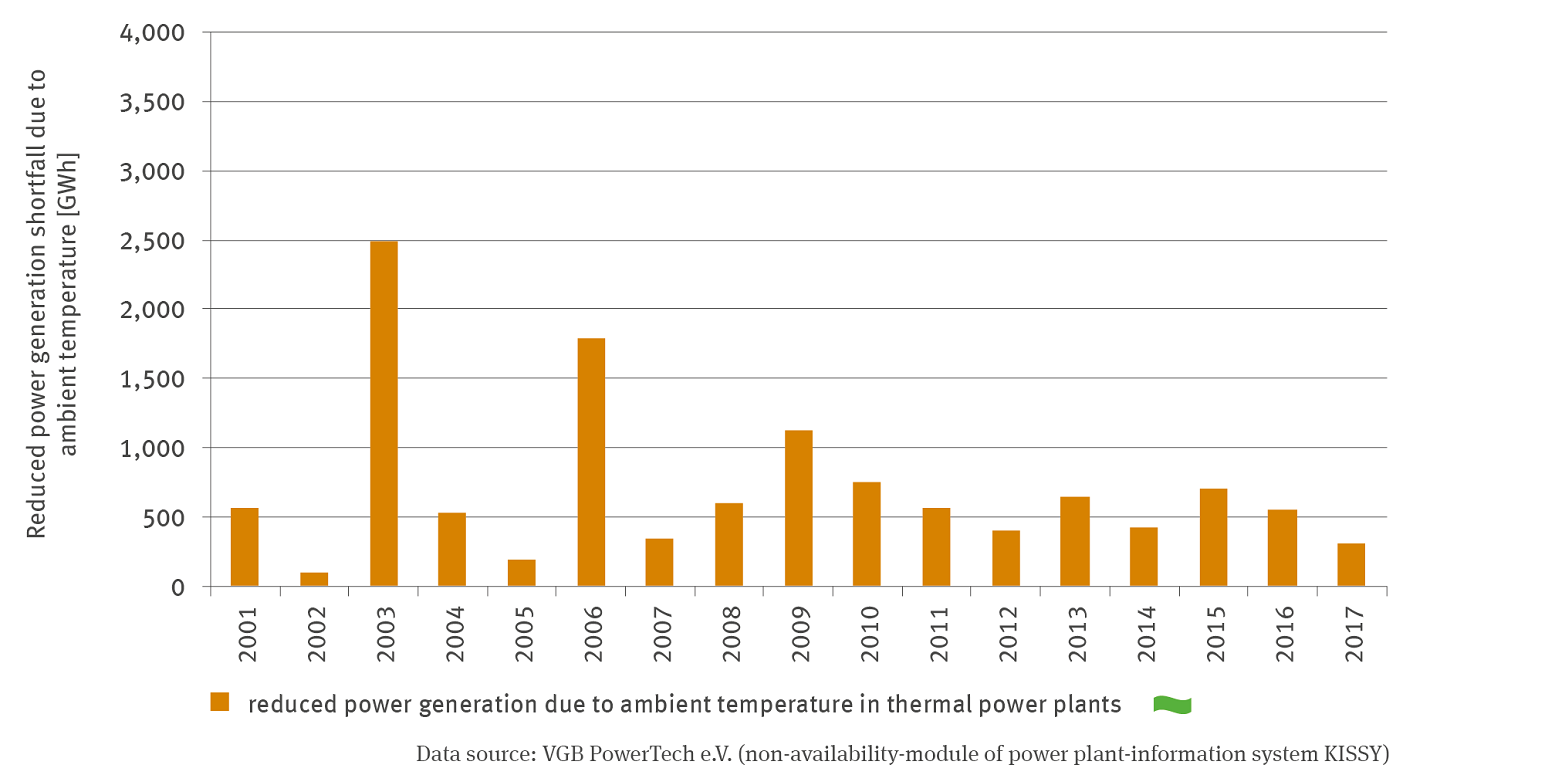
EW-I-3: Reduced power generation due to ambient temperature in thermal power plants
- Klima
- Energie
- Diagramme
Export data

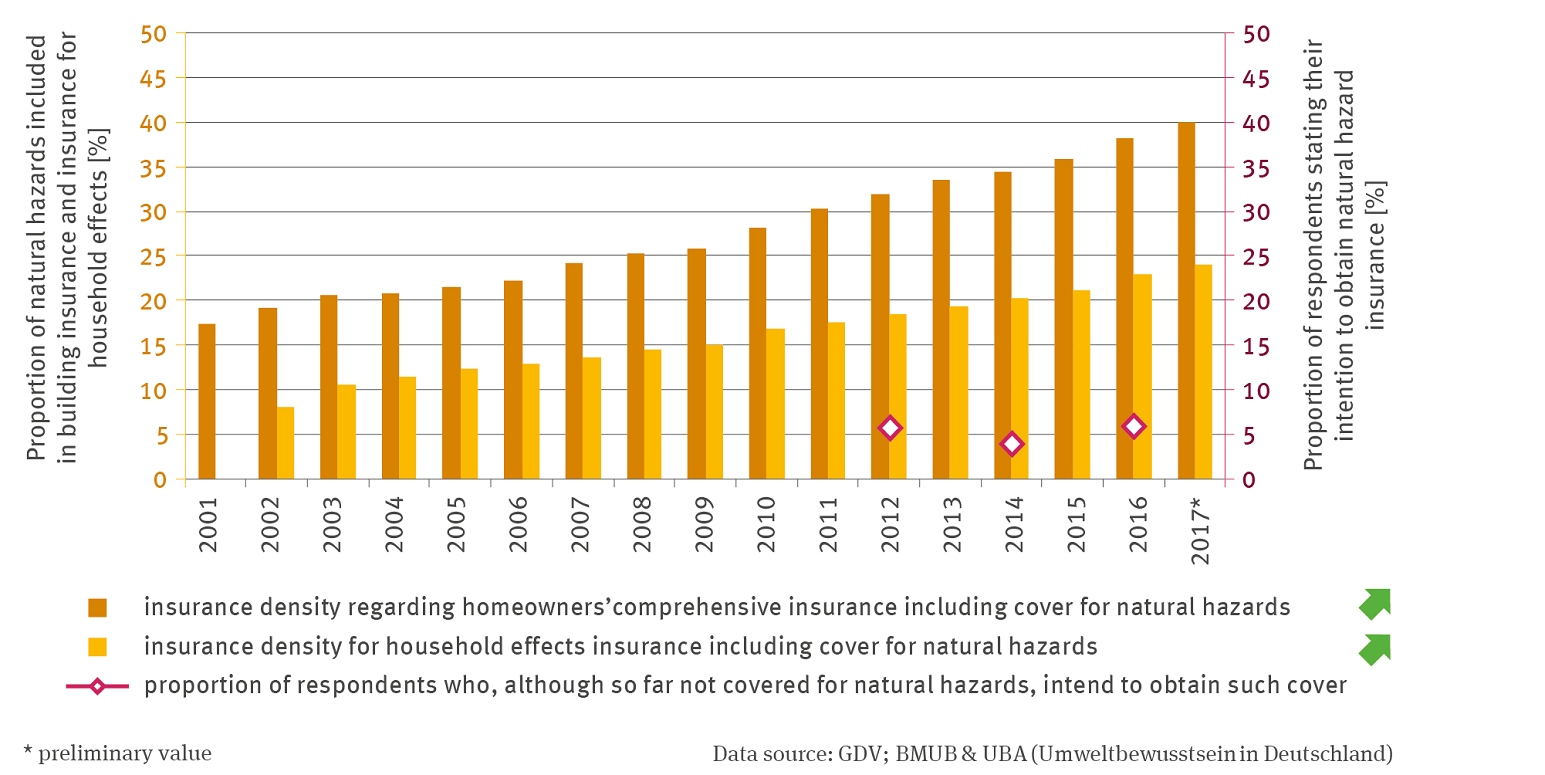
BAU-R-5: Insurance density of extended natural hazard insurance for residential buildings
- Klima
- Umwelt und Wirtschaft
- Diagramme
Export data