Data Search

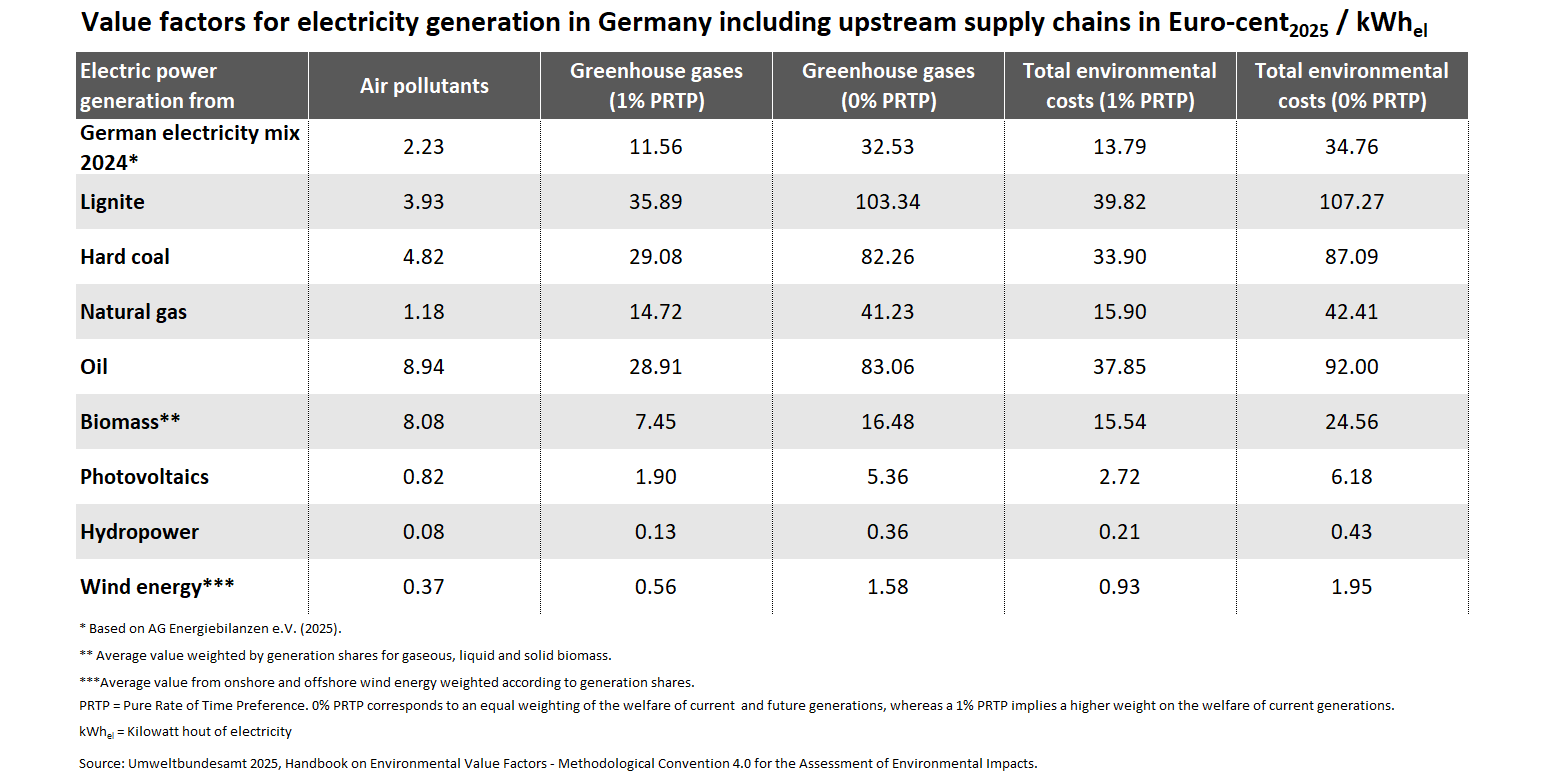
Value factors for greenhouse gas & air pollution related environmental impacts from power generation
- Klima
- Luft
- Daten und Tabellen

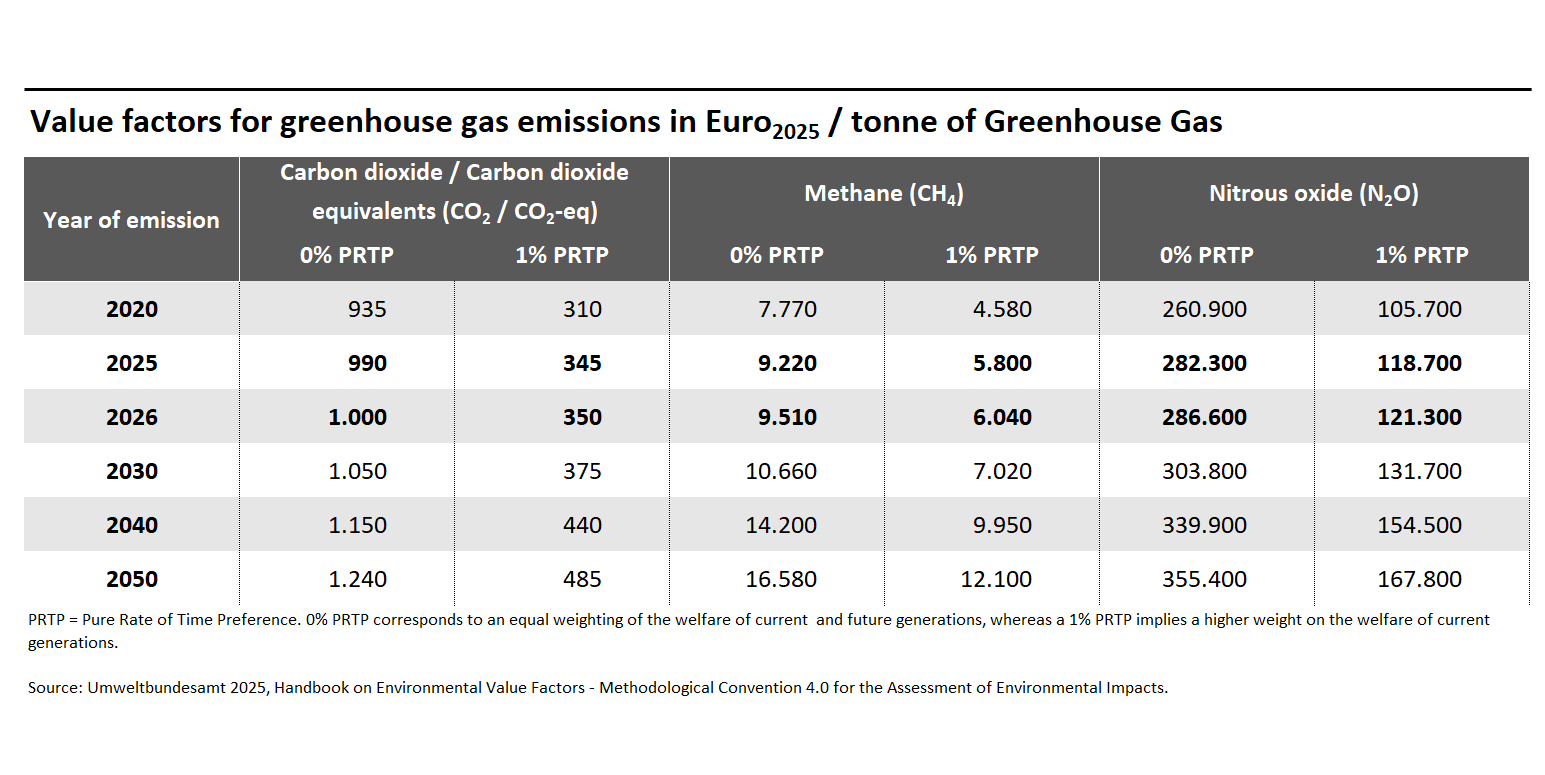
The emission of greenhouse gases leads to significant economic and societal damages.
- Klima
- Daten und Tabellen


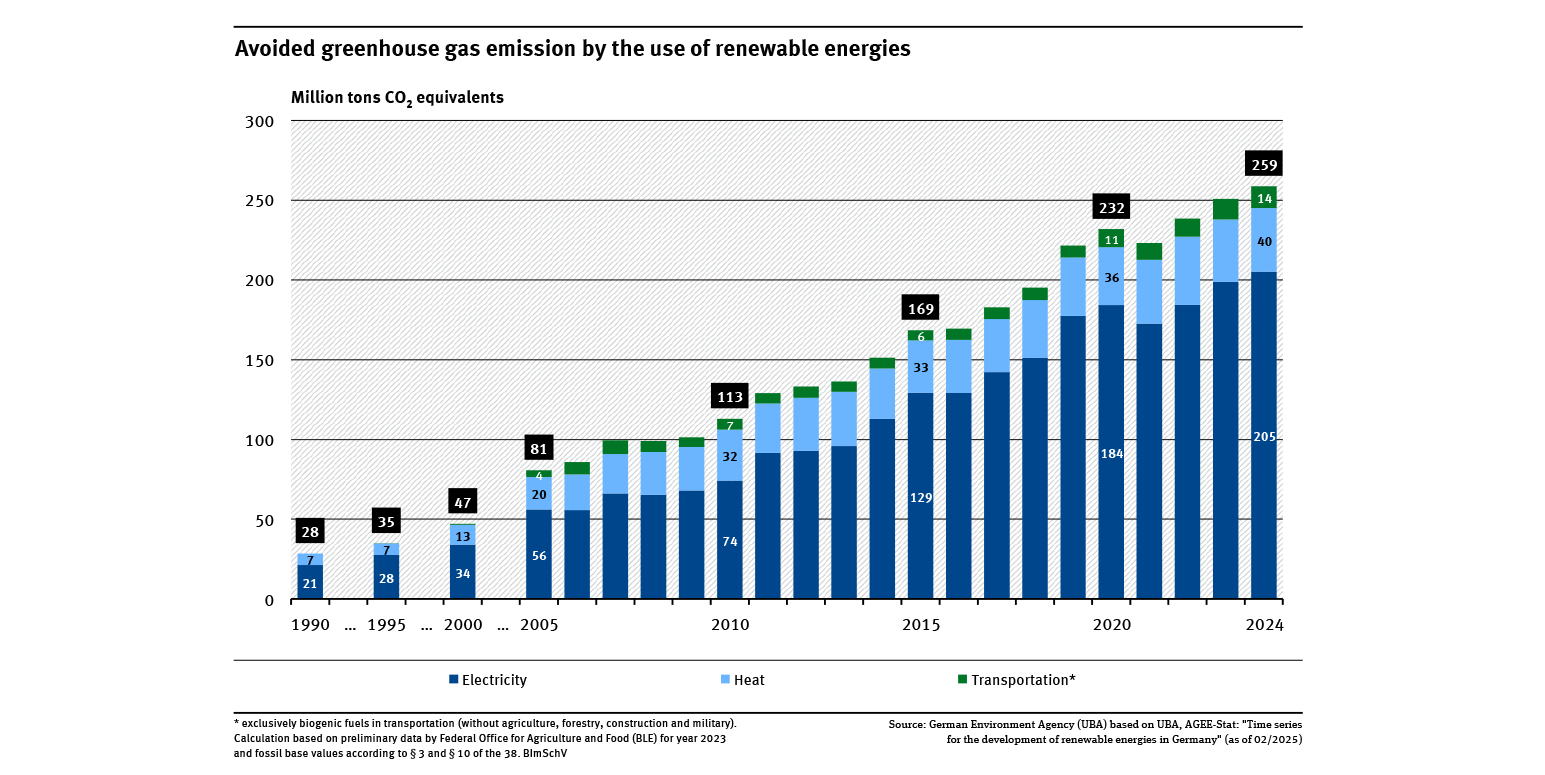
Greenhouse gas emissions avoided through the use of renewable energy sources
- Klima
- Energie
- Diagramme
- Umwelt-Indikatoren
- Daten und Tabellen

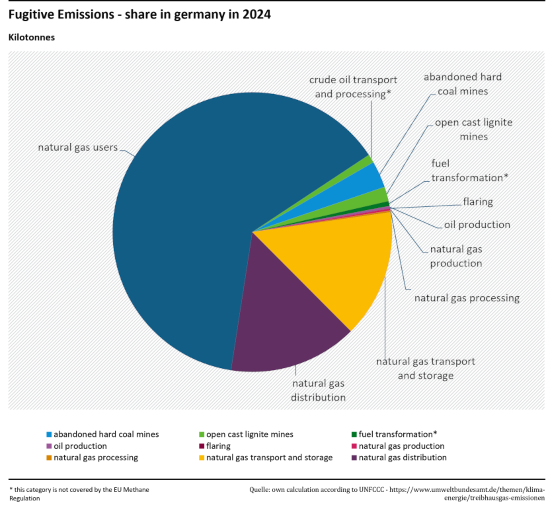
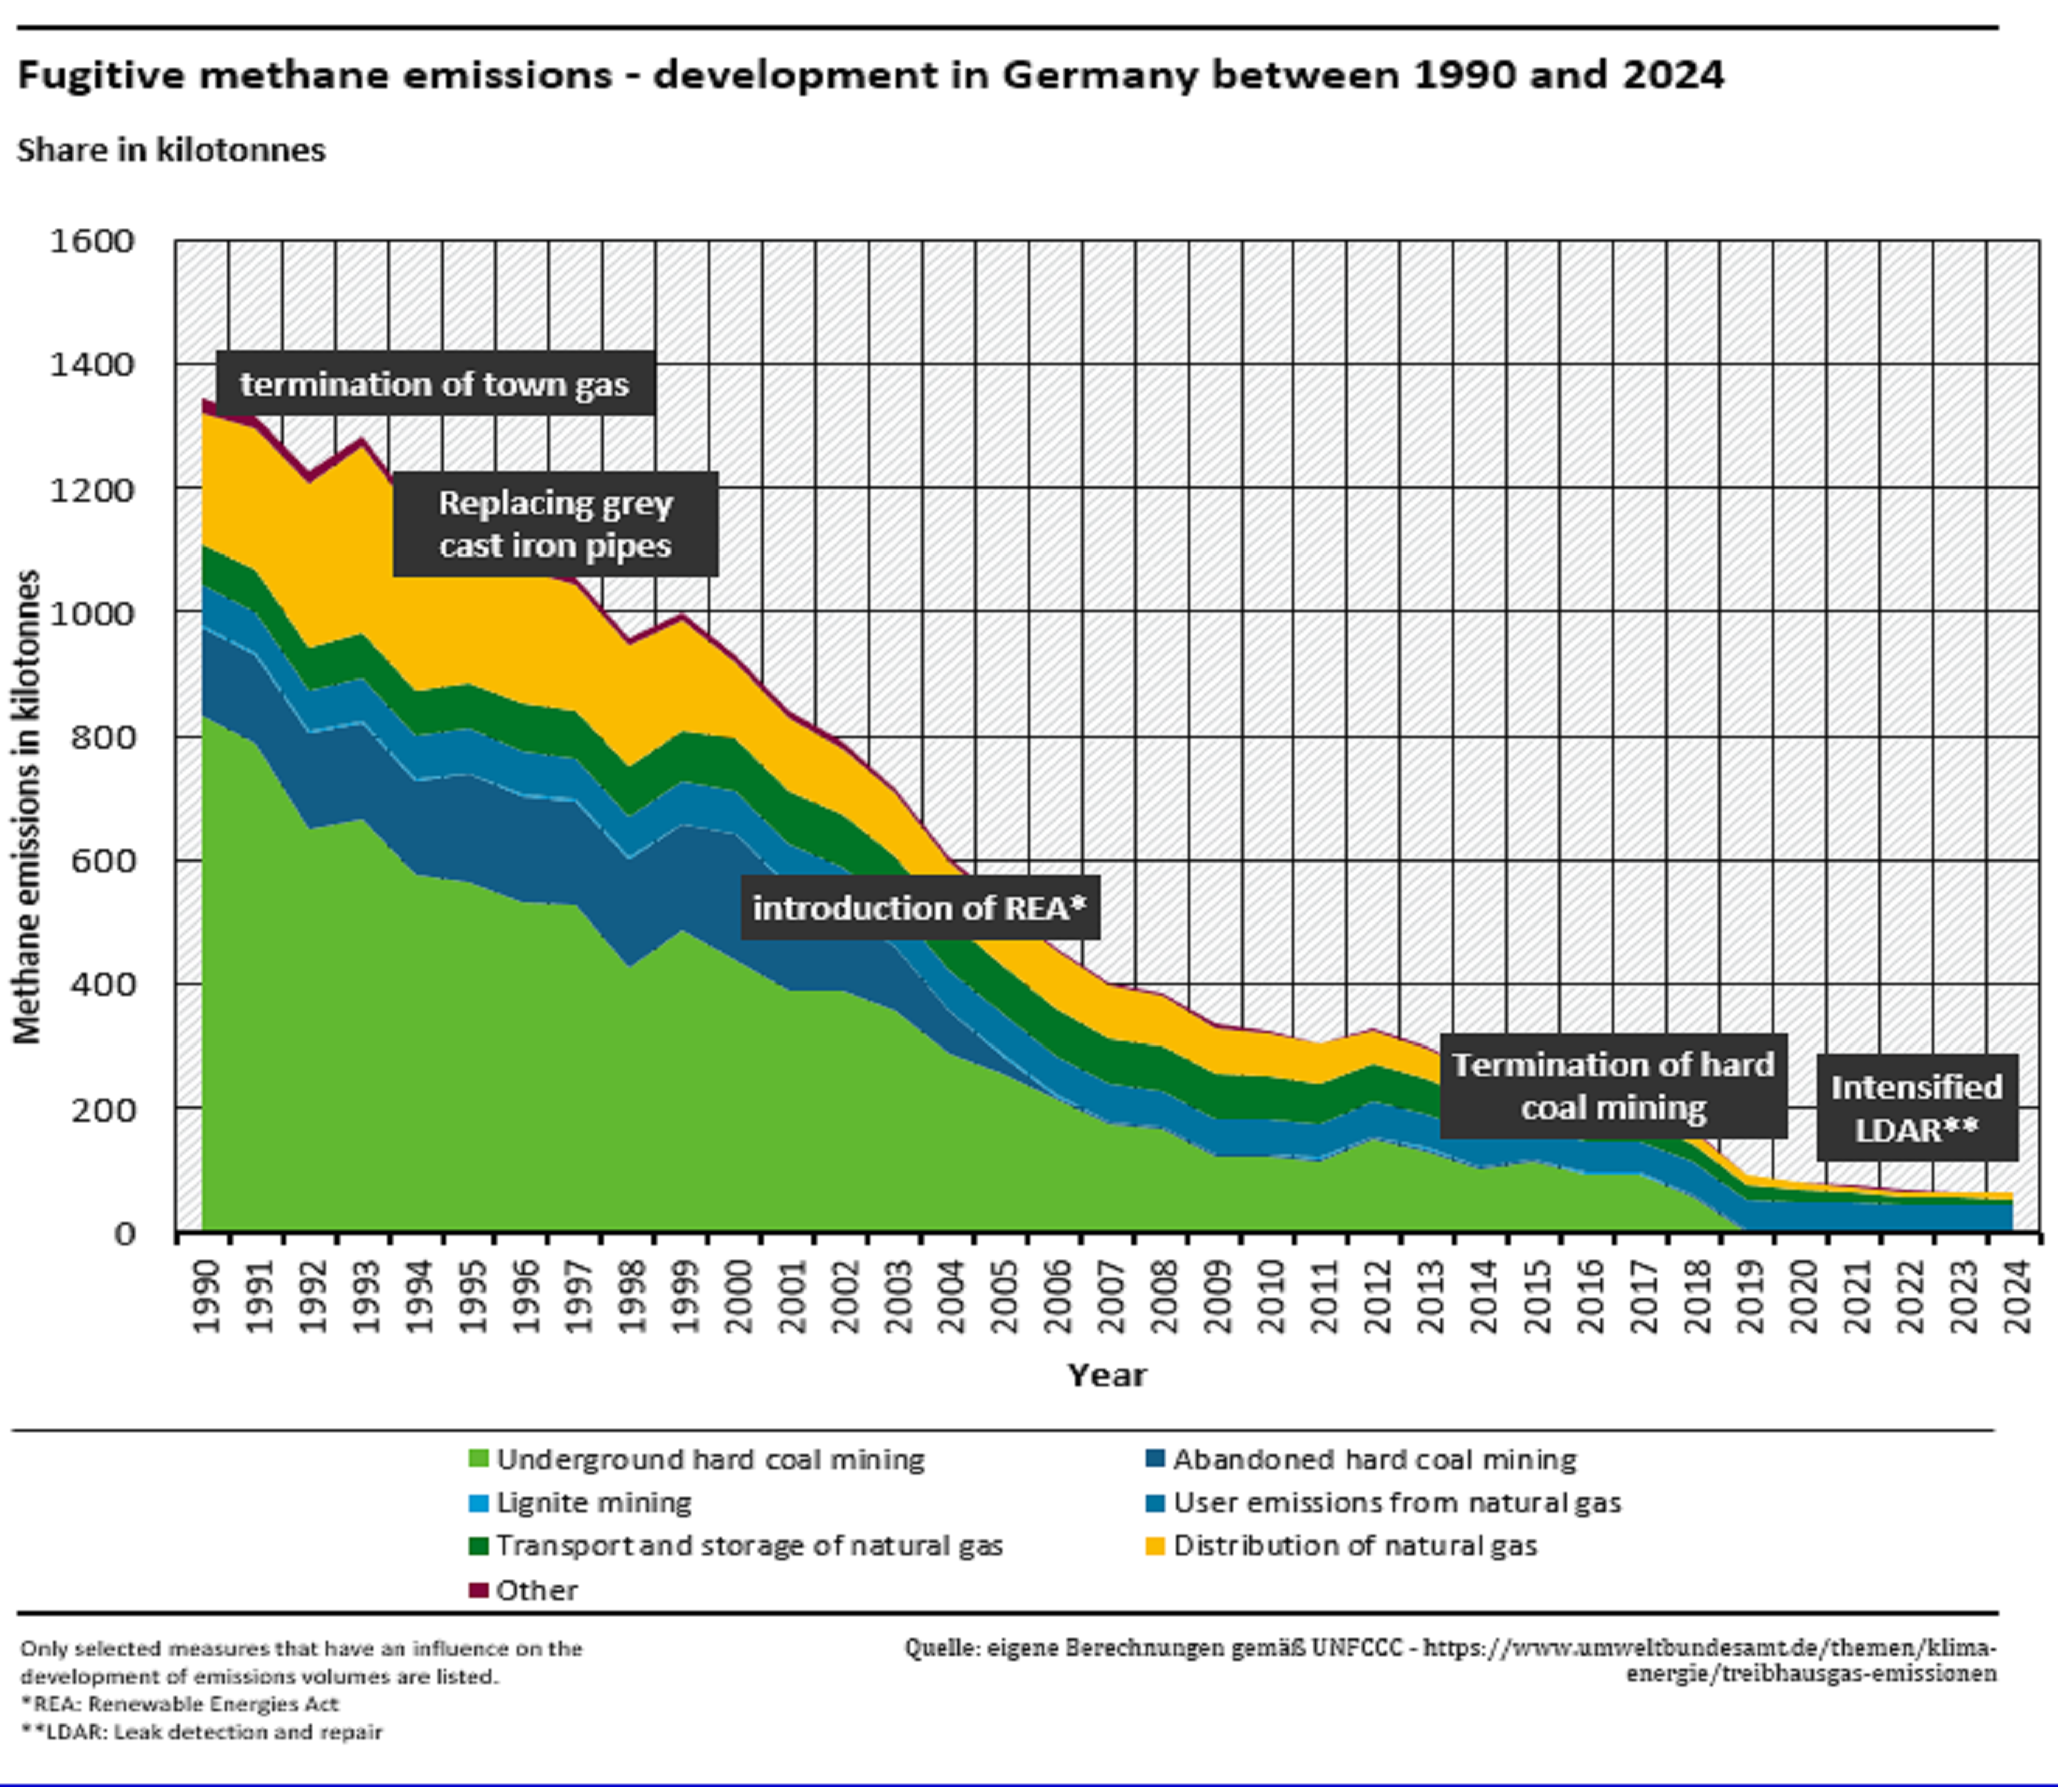
Fugitive methane emissions have fallen by 95 per cent since 1990
- Klima
- Diagramme

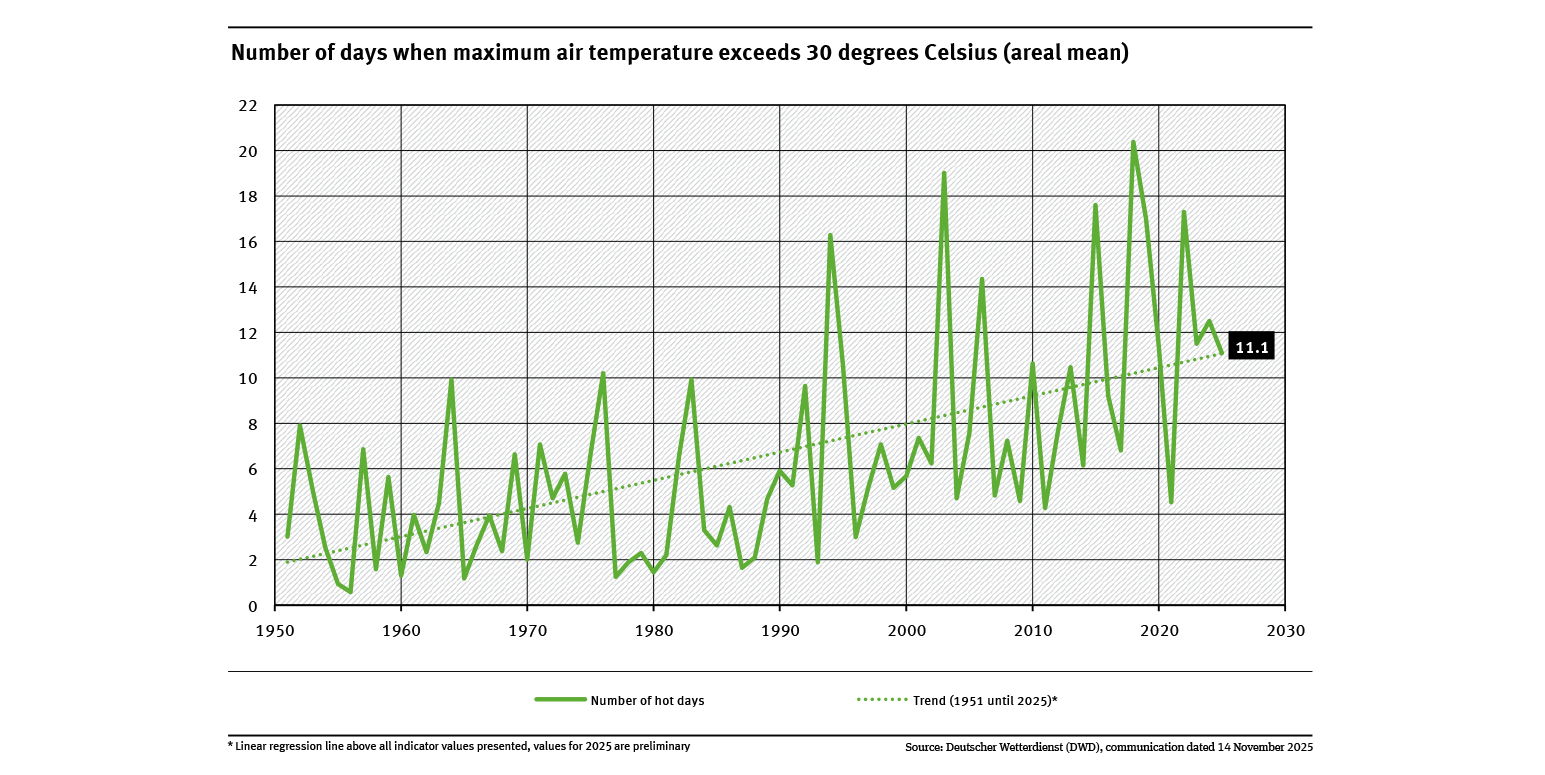
Number of days when maximum air temperature exceeds 30 degrees Celsius (areal mean)
- Klima
- Diagramme
- Umwelt-Indikatoren
- Daten und Tabellen

Time series for the development of renewable energy sources based on statistical data from the Working Group on Renewable Energy-Statistics (AGEE-Stat) in Germany (XLSX-file)
- Klima
- Energie
- Diagramme
- Infografiken
- Daten und Tabellen
Export data

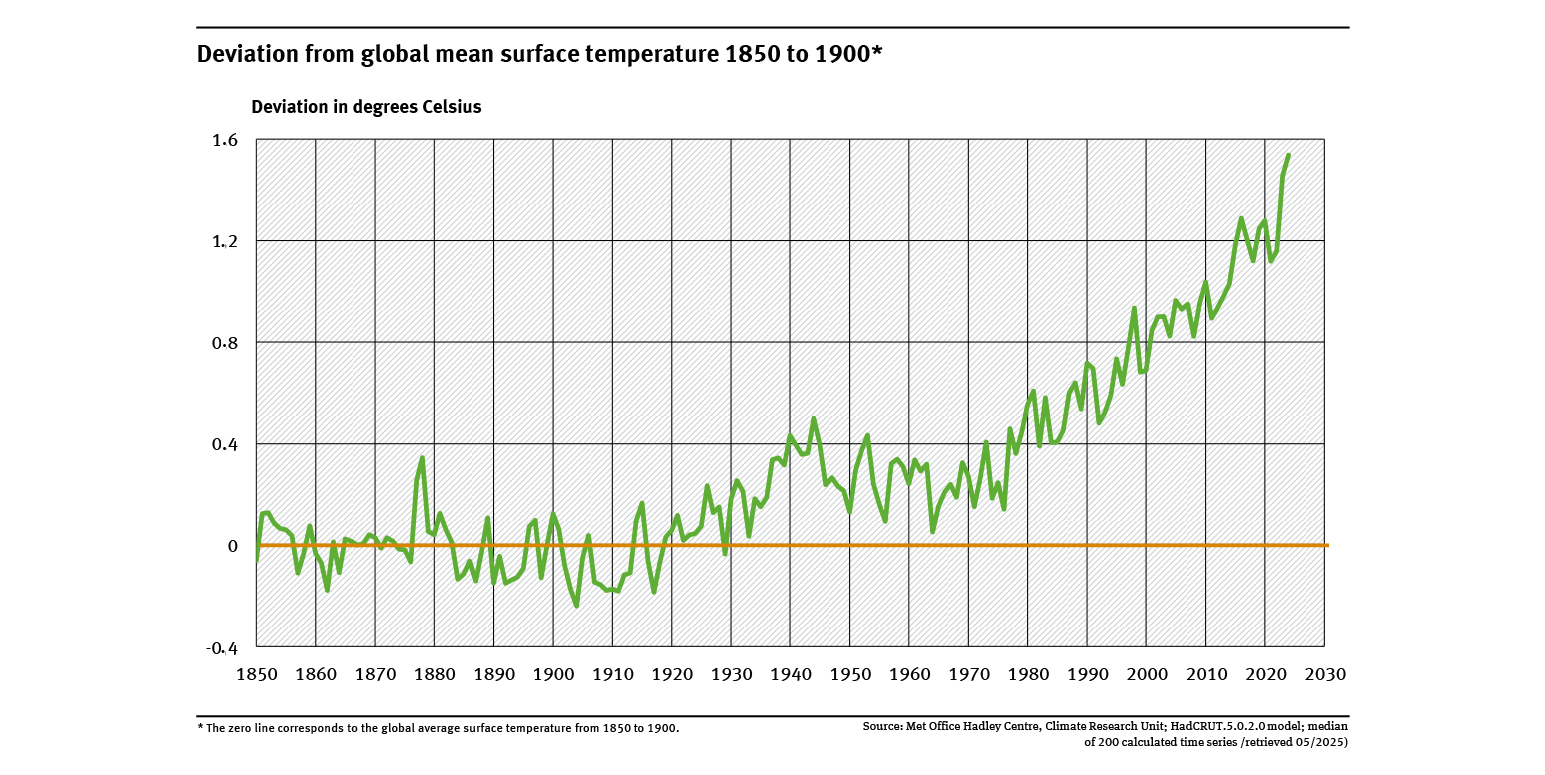
Deviation from global mean surface temperature 1850 to 1900
- Klima
- Diagramme
- Umwelt-Indikatoren
- Daten und Tabellen

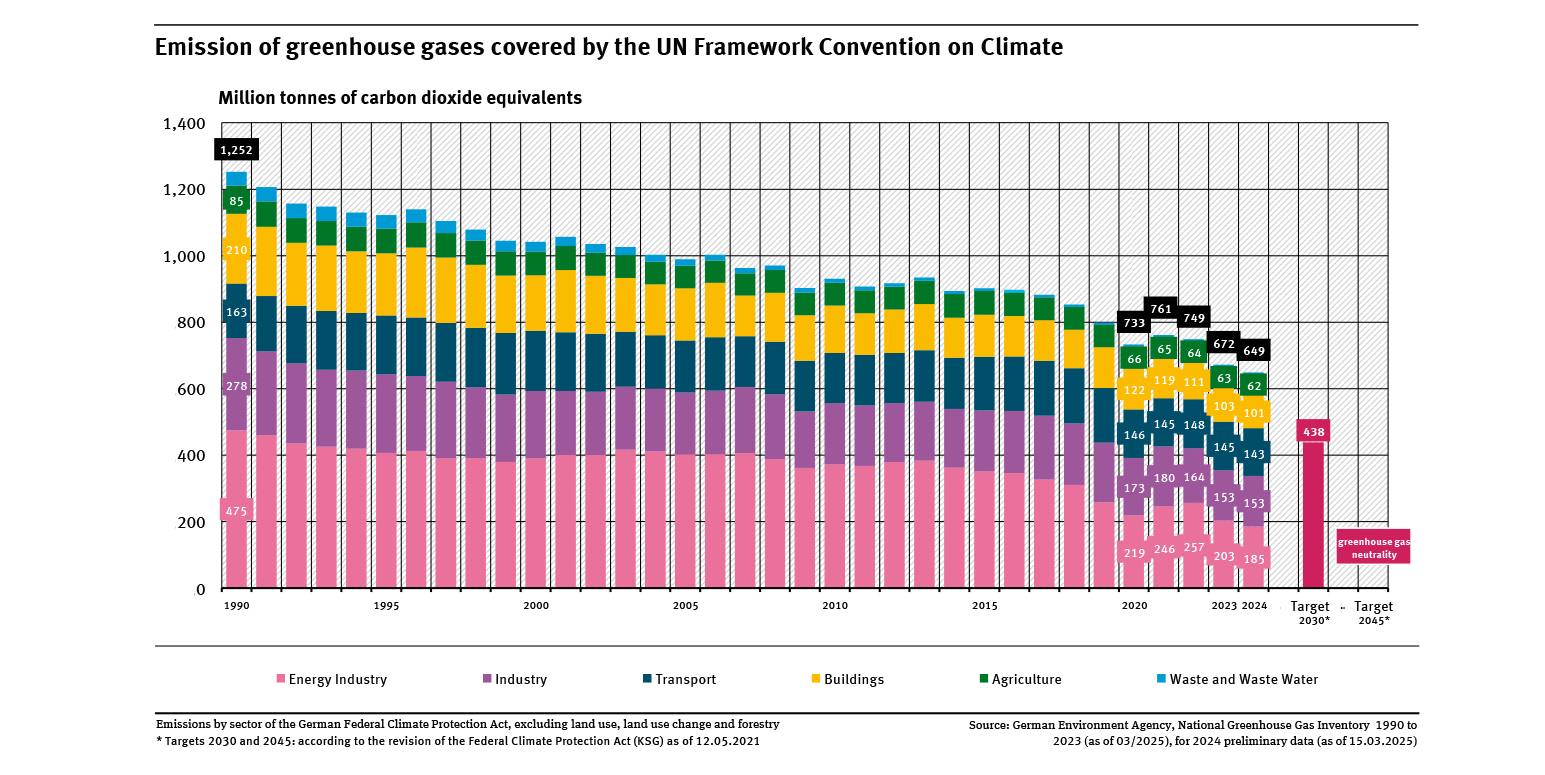
Emission of greenhouse gases covered by the UN Framework Convention on Climate
- Klima
- Diagramme
- Umwelt-Indikatoren
