Skip to main content Skip to main menu Skip to footer

Data Search

Data Search

Here you will find diagrams, infographics, maps and tables for direct download.

Data Search

The chart consists of three heavy-rain maps for Germany regarding the following warning levels 2 – extraordinary weather, 3 – tempest, and 4 – extremely severe weather. The total hours of precipitation are shown for the period 2001 to 2022 when warning thresholds were exceeded. For level 2 this amounts to more than 15 litres per square metre in one hour and more than 20 litres in 6 hours; for level 3 the amount is more than 25 litres per square metre in one hour and more than 35 litres in 6 hours;

Figure 8: Total of precipitation hours

  • Klima
  • Diagramme
Export data
PNG
 Figure 6: Mean annual number of hot days
Export data
PNG
A graph shows greenhouse gas emissions and gross value-added between 1995 and 2023. Greenhouse gas emissions fell from 237 million tonnes of carbon dioxide equivalents in 1995 to 155 million tonnes in 2023. Gross value-added increased during that time.

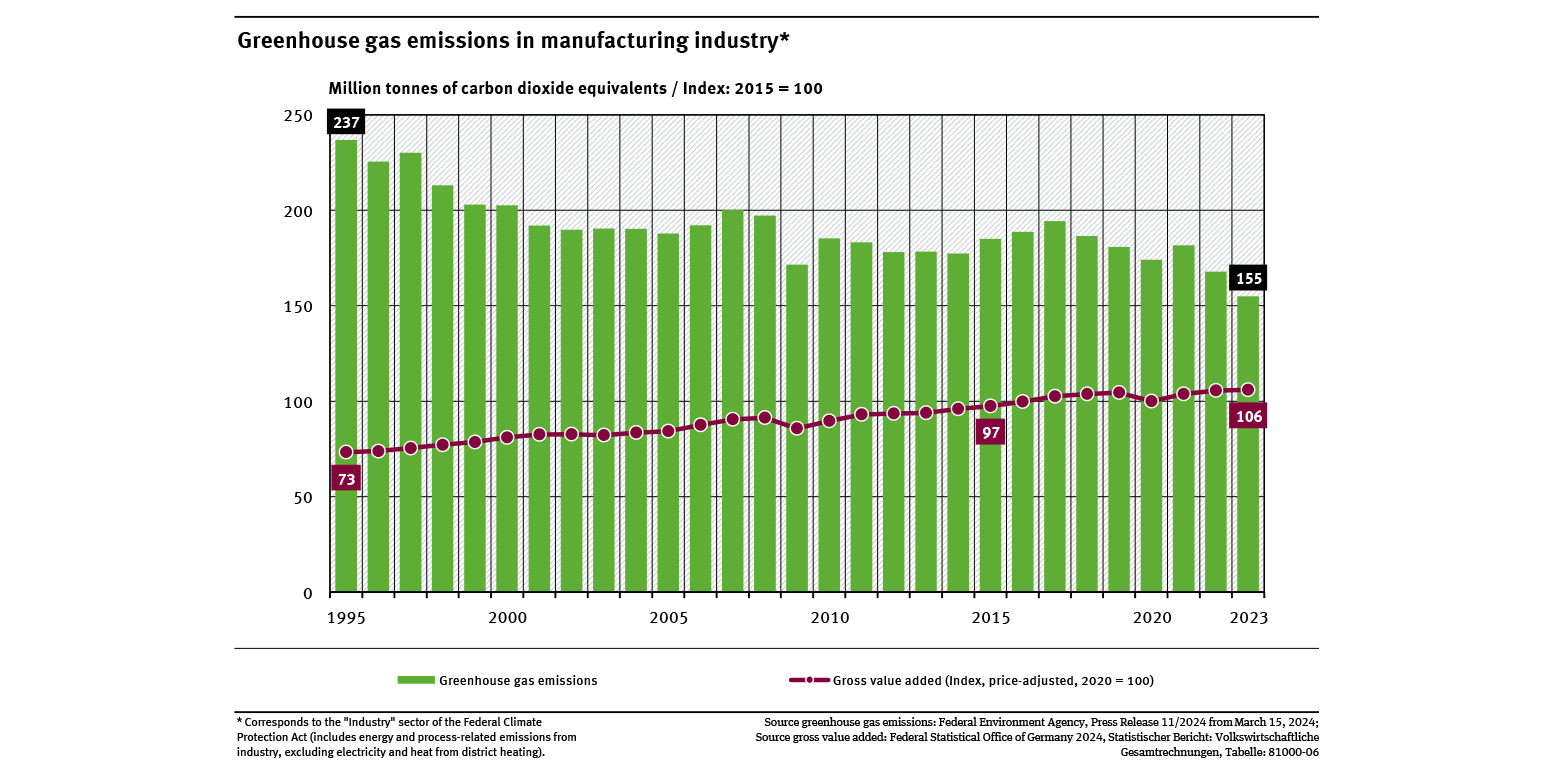
Greenhouse gas emissions in manufacturing industry

  • Klima
  • Umwelt und Wirtschaft
  • Diagramme
  • Umwelt-Indikatoren
  • Daten und Tabellen
Export data
Kinder pflanzen in Dessau ein Blumenbeet.

Children plant flowers in Dessau

  • Klima
  • Fläche, Boden, Land-Ökosysteme
  • Wasser
Export data
JPG
The chart shows that the emissions of electrical equipment in Germany has declined up to the year 1998: from approx. 50 tons in 1998 to approx. 10 tons in 2021.

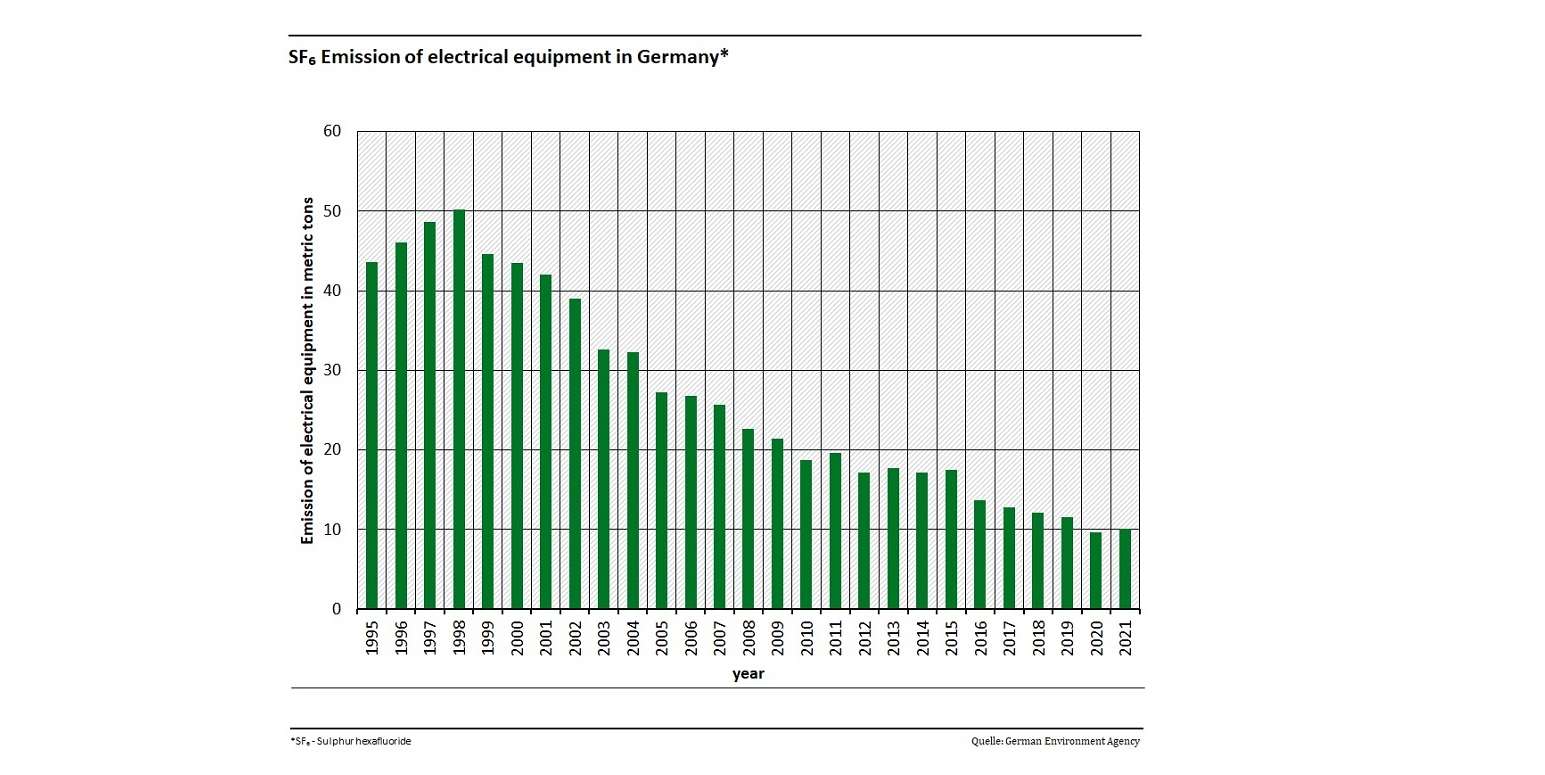
Emissions of electrical equipment in Germany

  • Klima
  • Energie
  • Umwelt und Wirtschaft
  • Diagramme
Export data
PNG
The line graph represents the amount of water for single use (with a significant decreasing trend) and water efficiency (with a significant increasing trend) from 1991 to 2016 on a scale indexed to 100 for 1991. The additionally depicted time series for electricity generation of thermal power plants, which extends to 2017, shows a quadratically decreasing trend.

EW-R-4: Water efficiency of thermal power plants

  • Klima
  • Energie
  • Diagramme
Export data
PNG
Three stacking columns represent the assessment of being affected by storms and floods for the years 2012, 2014 and 2016. The percentage of respondents is read below for the respective categories with ascending year: not affected at all: 36, 36 and 30 percent; less affected: 45, 41 and 48 percent, strongly affected: 17, 16 and 17 percent, very strongly affected: 2, 4 and 3. From 2014 onwards, there is also the category don't know.

FiW-I-2: Incidence of storms and floods

  • Klima
  • Umwelt und Wirtschaft
  • Diagramme
Export data
PNG
Two lines show the market shares of holiday trips to European destinations, specifically to the Mediterranean and to Scandinavia and Western Europe. In a stacked column display, a secondary axis shows the percentage market shares of holiday trips to Germany and abroad.

TOU-I-7: Holiday destination preferences

  • Klima
  • Private Haushalte und Konsum
  • Diagramme
Export data
PNG
The line diagram depicts the ratio of overnight stays in the low season (III-V, X) and in the high season (VI-IX).

TOU-I-6: Seasonal bed nights in German tourist areas

  • Klima
  • Private Haushalte und Konsum
  • Diagramme
Export data
PNG

You can also search in other data portals of the German Environment Agency

Short link: www.umweltbundesamt.de/n300701en