Data Search

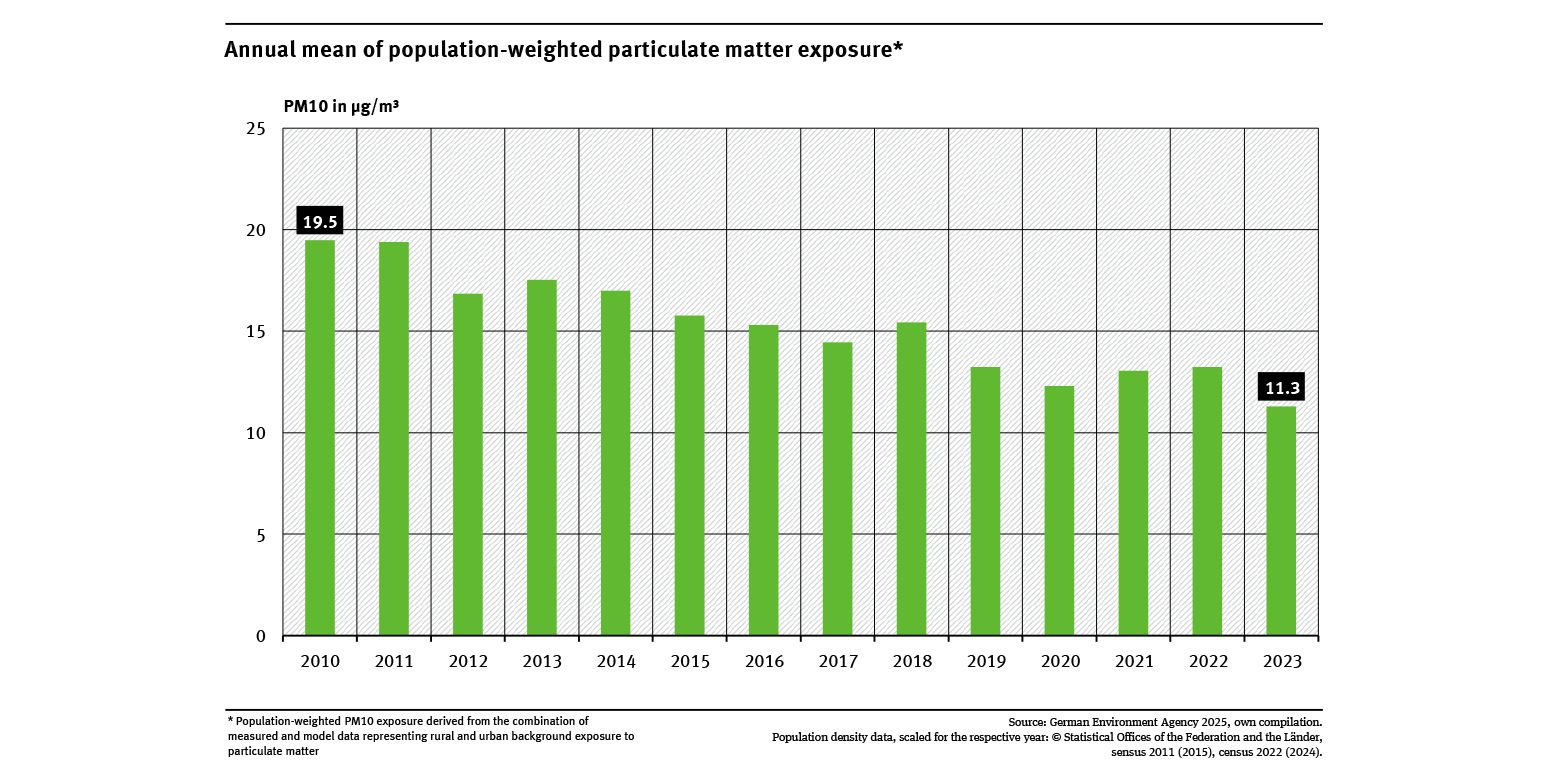
Annual mean of population-weighted particulate matter exposure
- Luft
- Umwelt und Gesundheit
- Diagramme
- Umwelt-Indikatoren
- Daten und Tabellen

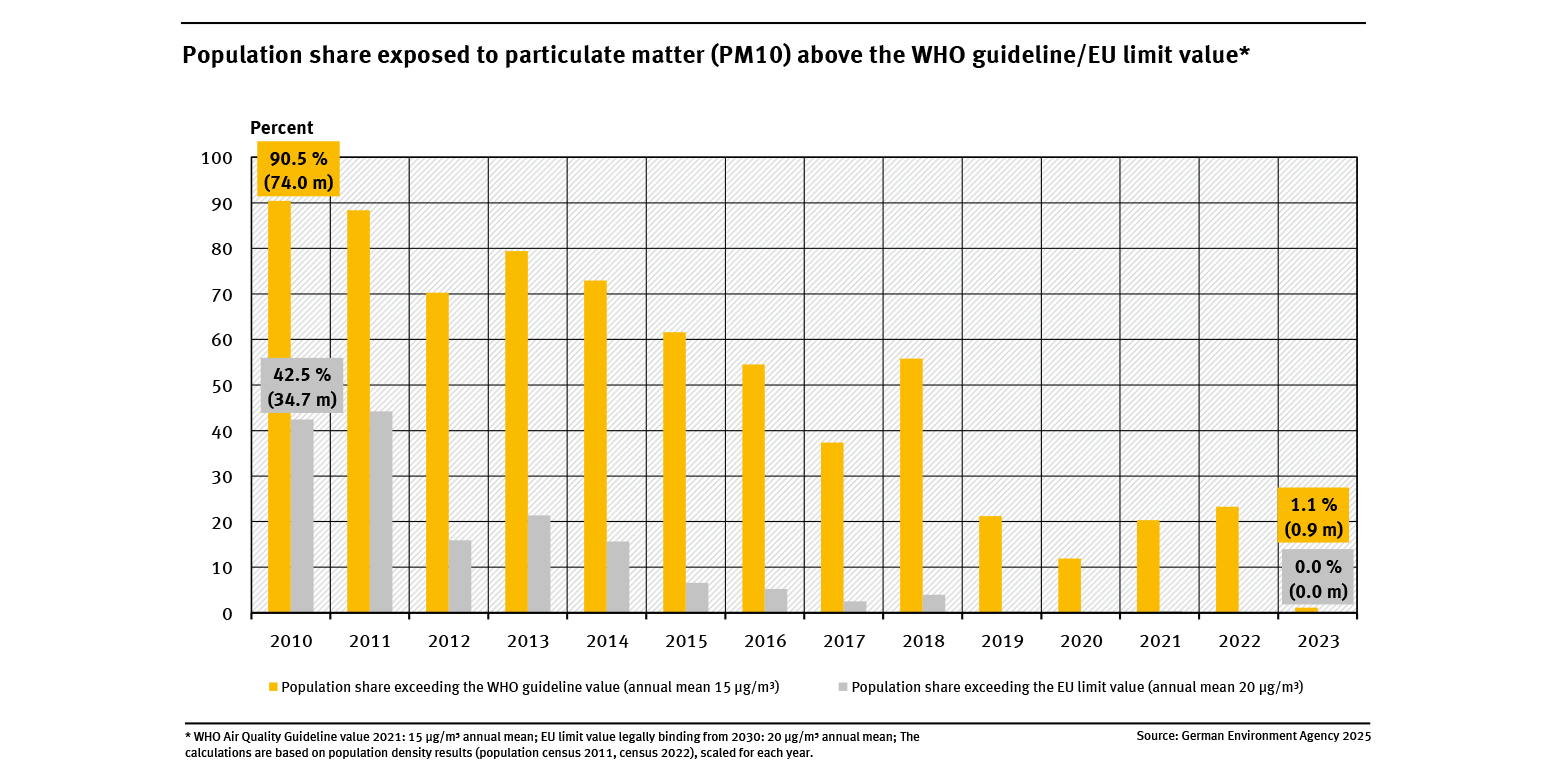
Population share exposed to particulate matter (PM10) above the WHO guideline/EU limit value
- Luft
- Umwelt und Gesundheit
- Diagramme
- Umwelt-Indikatoren
- Daten und Tabellen

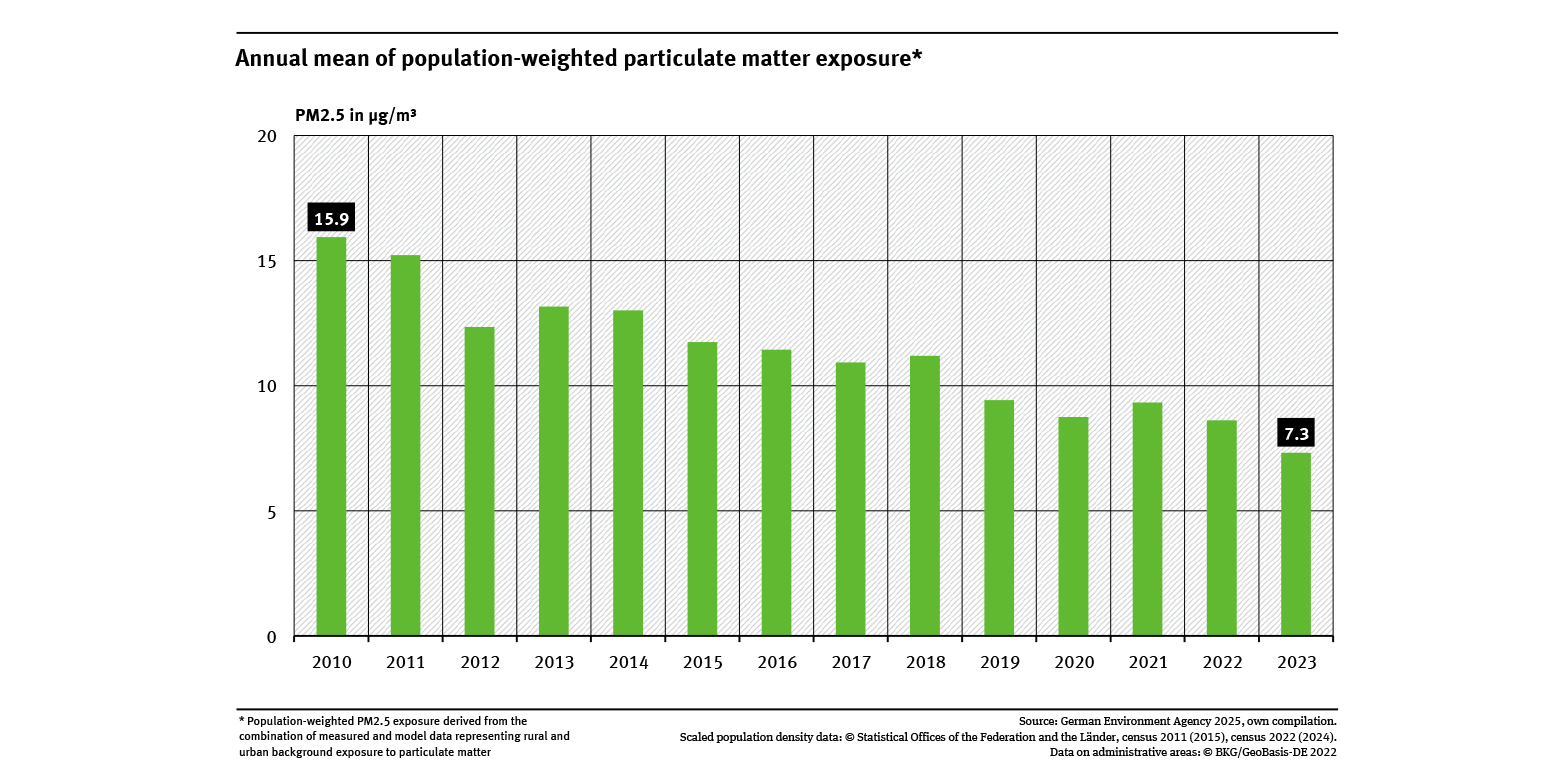
Annual mean of population-weighted particulate matter exposure
- Luft
- Umwelt und Gesundheit
- Diagramme
- Umwelt-Indikatoren
- Daten und Tabellen

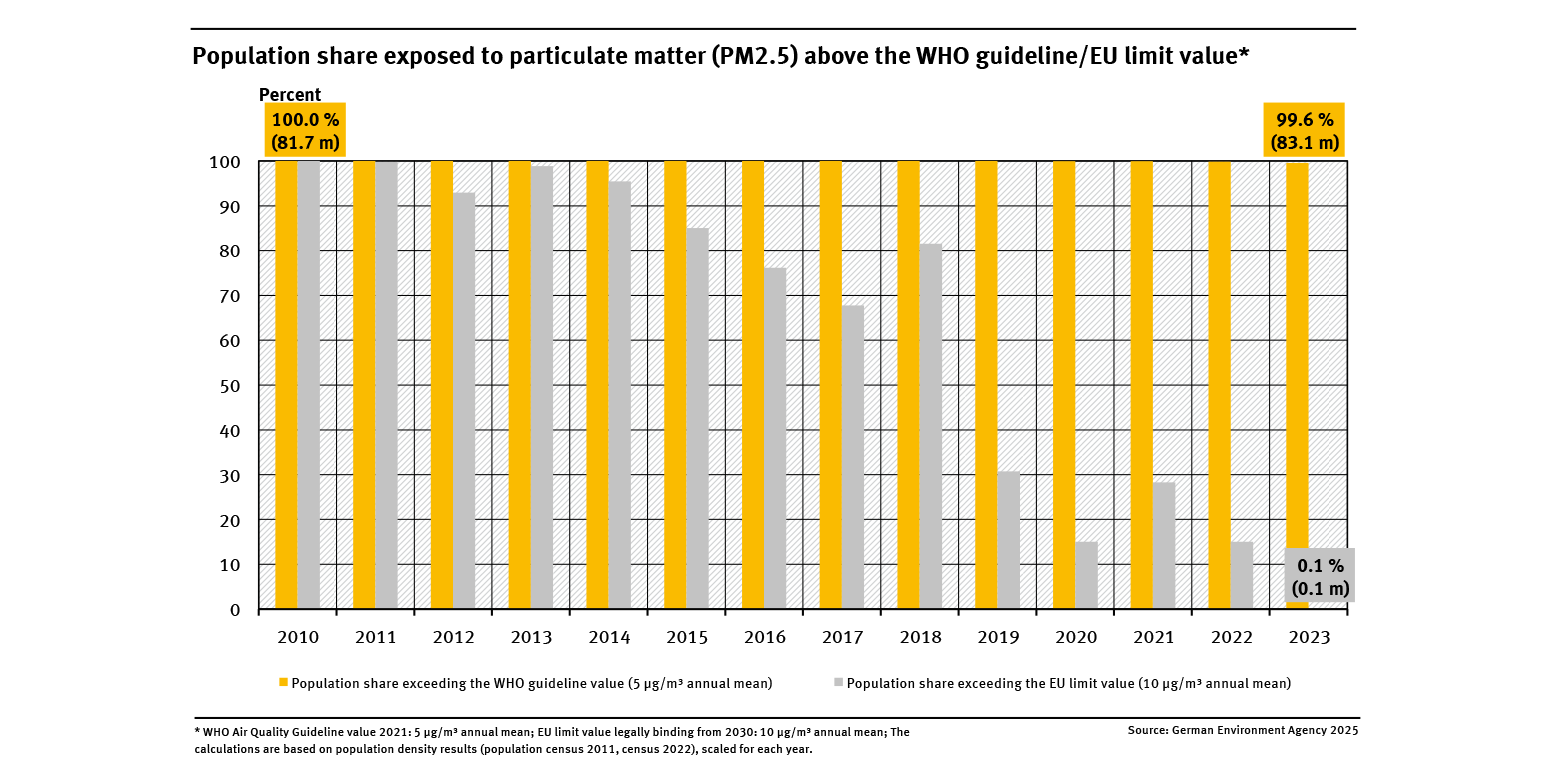
Population share exposed to particulate matter (PM2.5) above the WHO guideline/EU limit value
- Luft
- Umwelt und Gesundheit
- Diagramme
- Umwelt-Indikatoren
- Daten und Tabellen

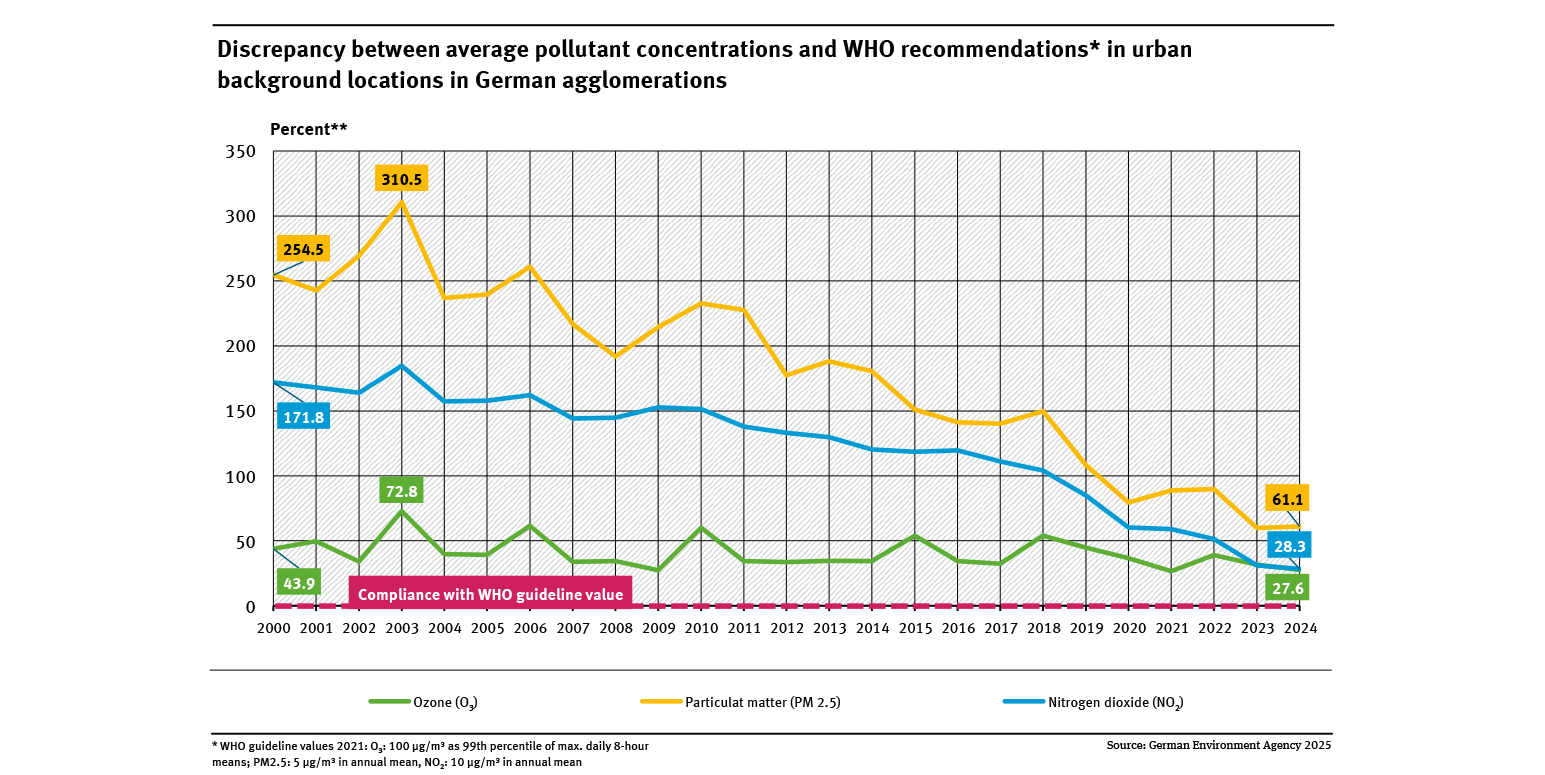
Discrepancy between average pollutant concentrations and WHO recommendations ...
- Luft
- Umwelt und Gesundheit
- Diagramme
- Umwelt-Indikatoren
- Daten und Tabellen

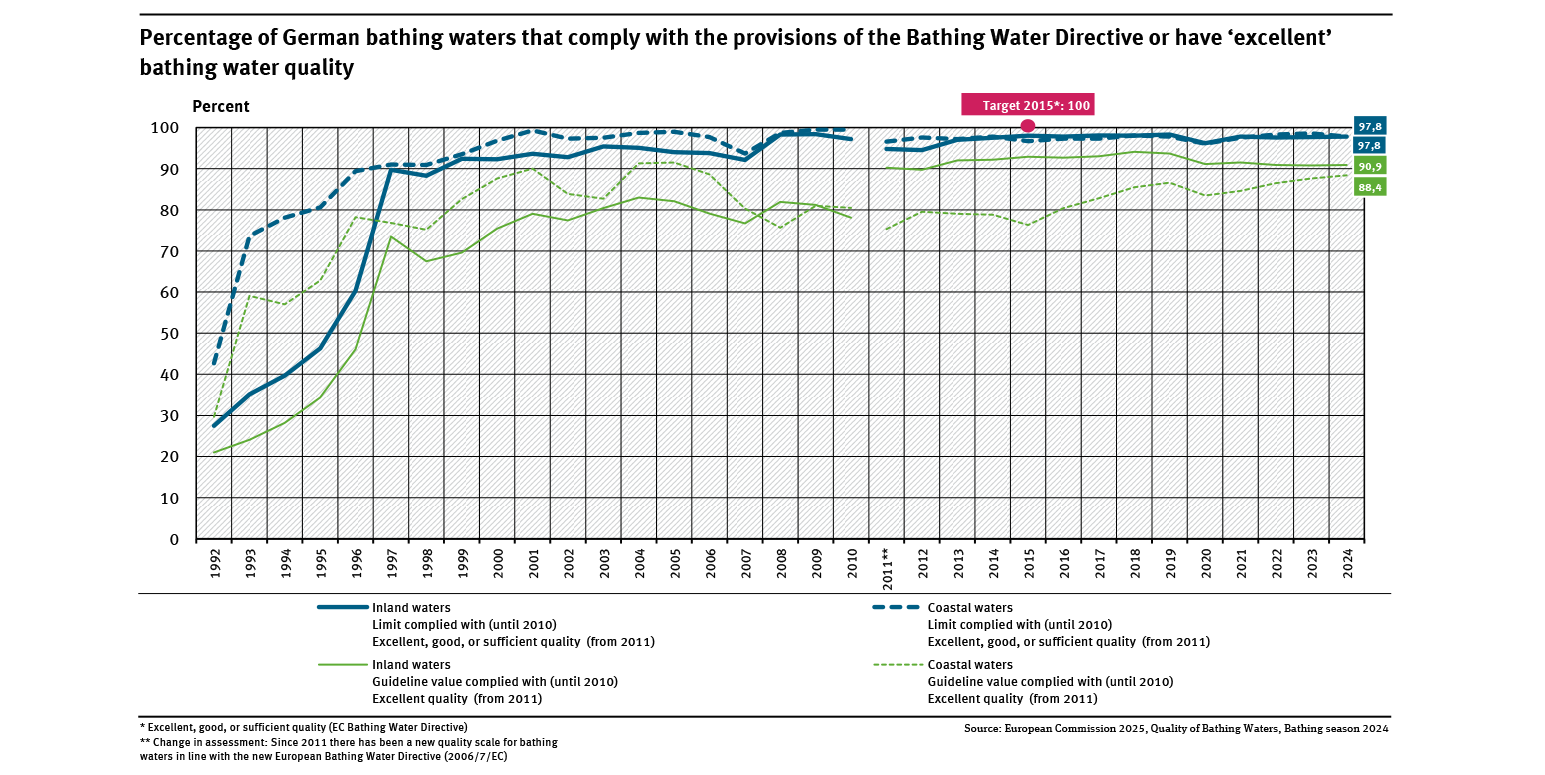
Percentage of German bathing waters that comply with the provisions of the Bathing Water Directive..
- Wasser
- Umwelt und Gesundheit
- Diagramme
- Umwelt-Indikatoren
- Daten und Tabellen

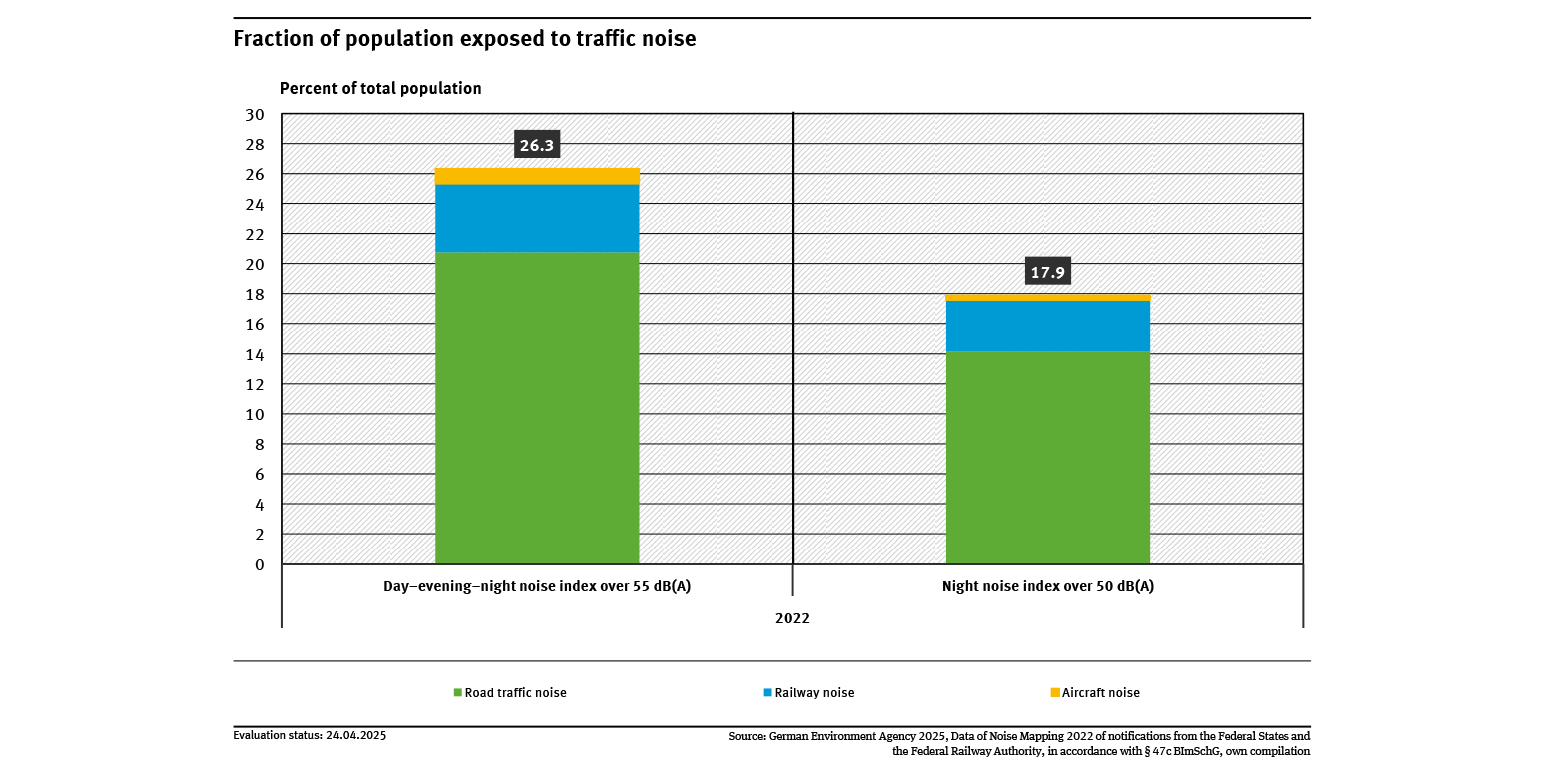
Fraction of population exposed to traffic noise
- Umwelt und Gesundheit
- Verkehr
- Diagramme
- Umwelt-Indikatoren
- Daten und Tabellen


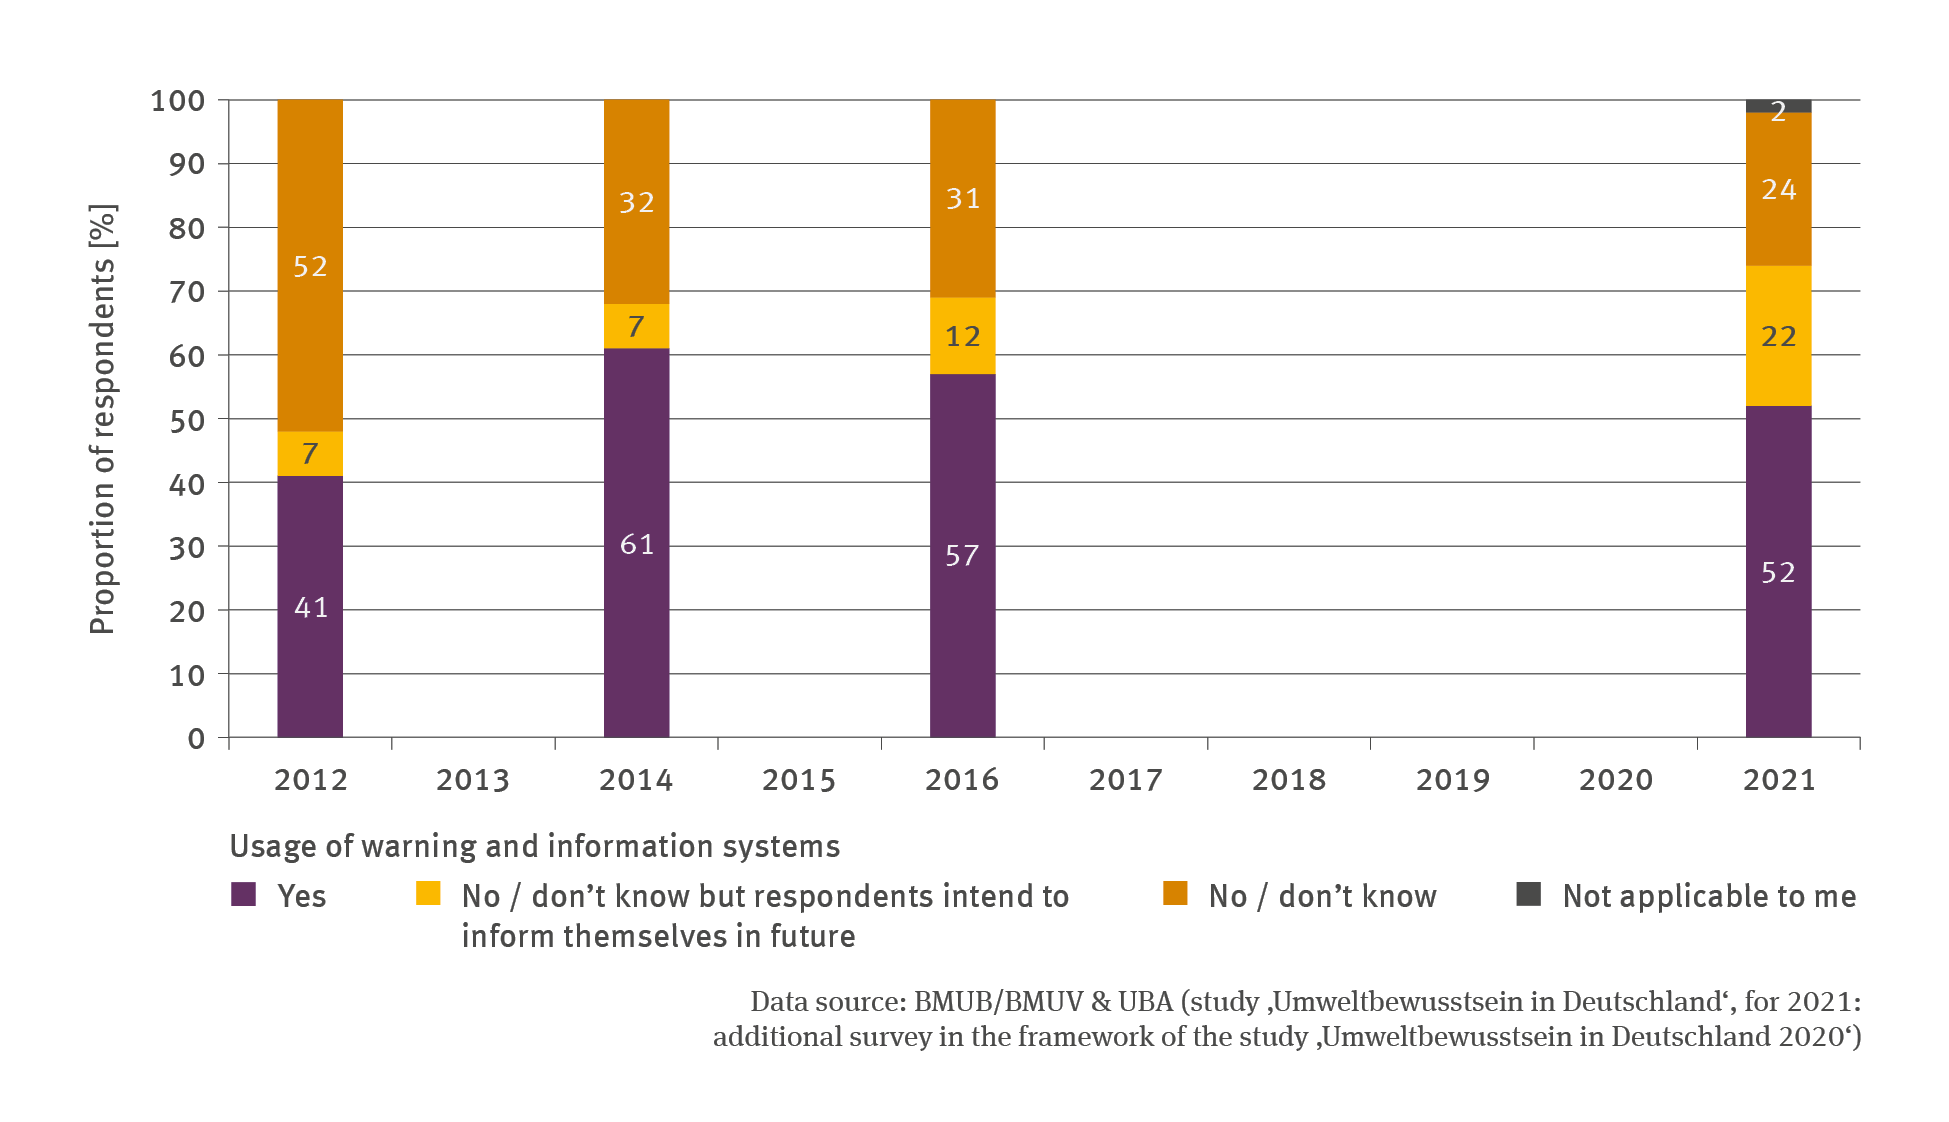
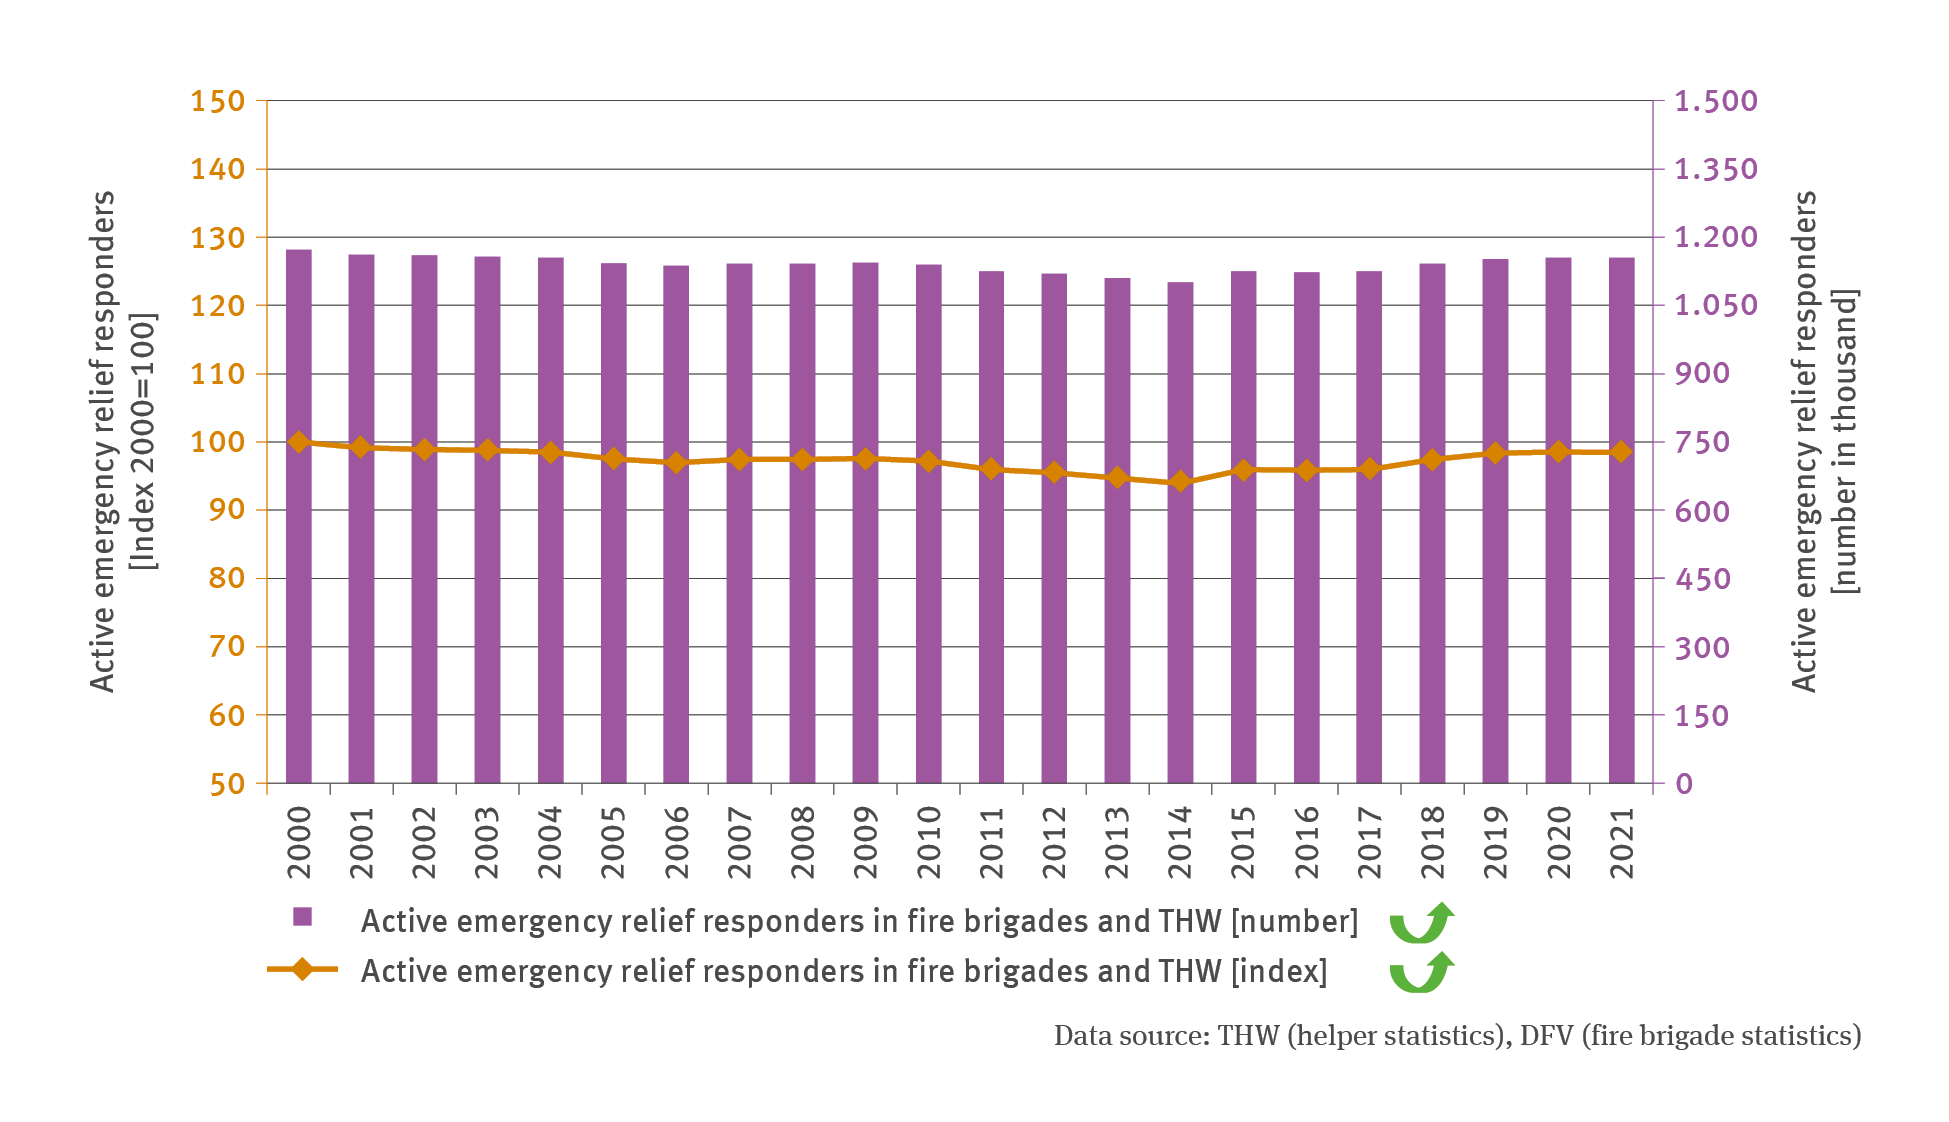
BS-R-4: Active emergency relief responders in civic protection
- Klima
- Umwelt und Gesundheit
- Diagramme
Export data
