Skip to main content Skip to main menu Skip to footer

Data Search

Data Search

Here you will find diagrams, infographics, maps and tables for direct download.

Data Search

The stacking column represents changes in the stock of organic carbon between the first and second BZE. Three classes were formed: Decrease to low increase (less than or equal to 0.23 tonnes per hectare per year), moderate increase (between more than 0.23 to less than or equal to 0.45 tonnes per hectare per year) and high increase (more than 0.45 tonnes per hectare per year). For these initial evaluations, the category boundaries were set so that each class has a share of about one third.

FW-R-5: Humus reserves in forest soils

  • Klima
  • Fläche, Boden, Land-Ökosysteme
  • Diagramme
Export data
PNG
The line graph shows the rainfall intensity in kilojoules per square metre times millimetres per hour. The period from 1970 to 2007 is shown. The values fluctuate strongly between the years and range from less than 20 in 1976 to more than 90 in 2006. The time series has a significantly increasing trend.

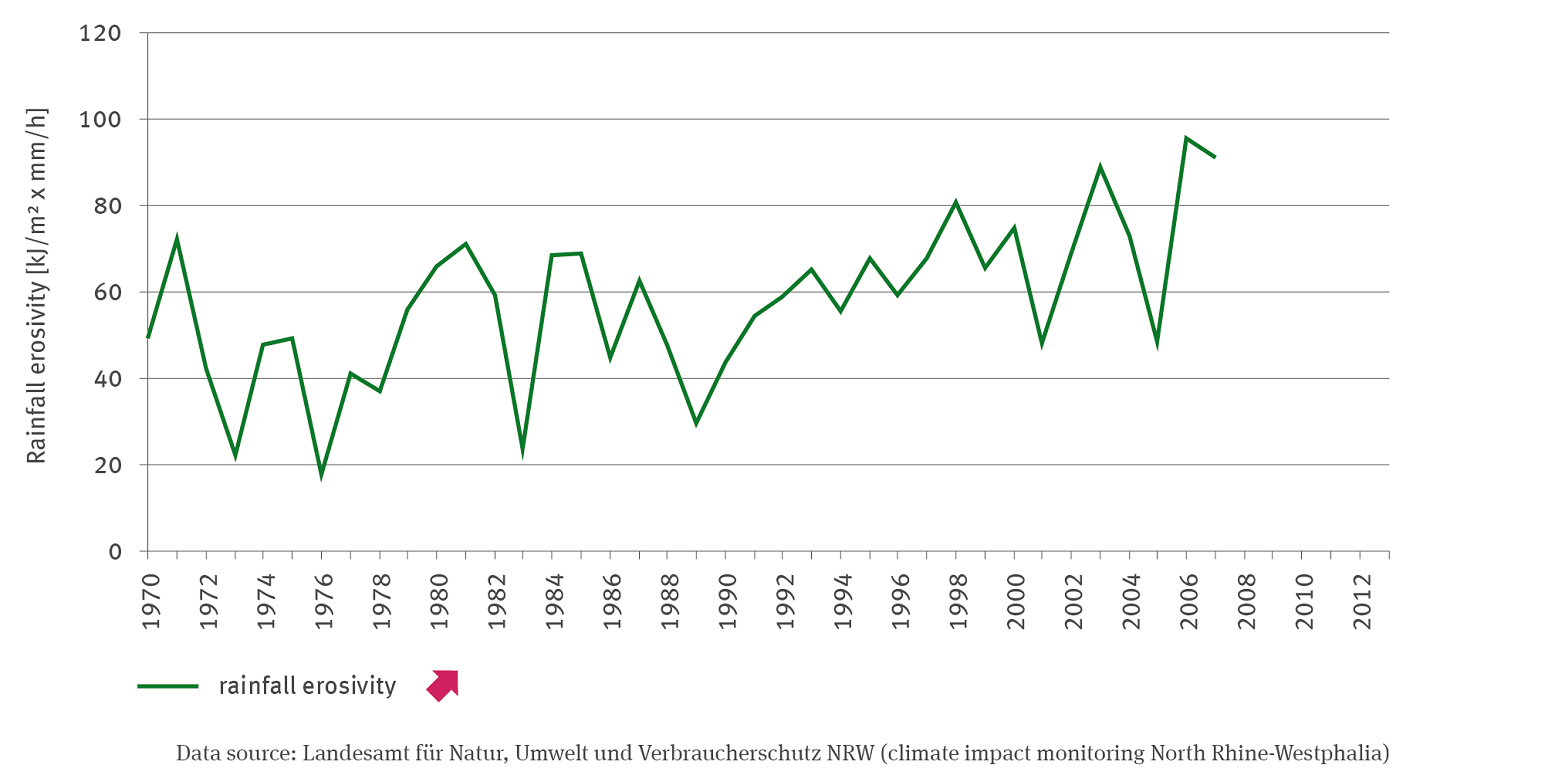
BO-I-2: Rainfall erosivity – case study

  • Klima
  • Fläche, Boden, Land-Ökosysteme
  • Wasser
  • Diagramme
Export data
PNG
A graph shows the undissected low-traffic areas with a minimum size of 100 km² as a percentage of Germany’s total land area for 2000, 2005, 2010 and 2015 and the target value. Due to differences in methodology, the values are not directly comparable.

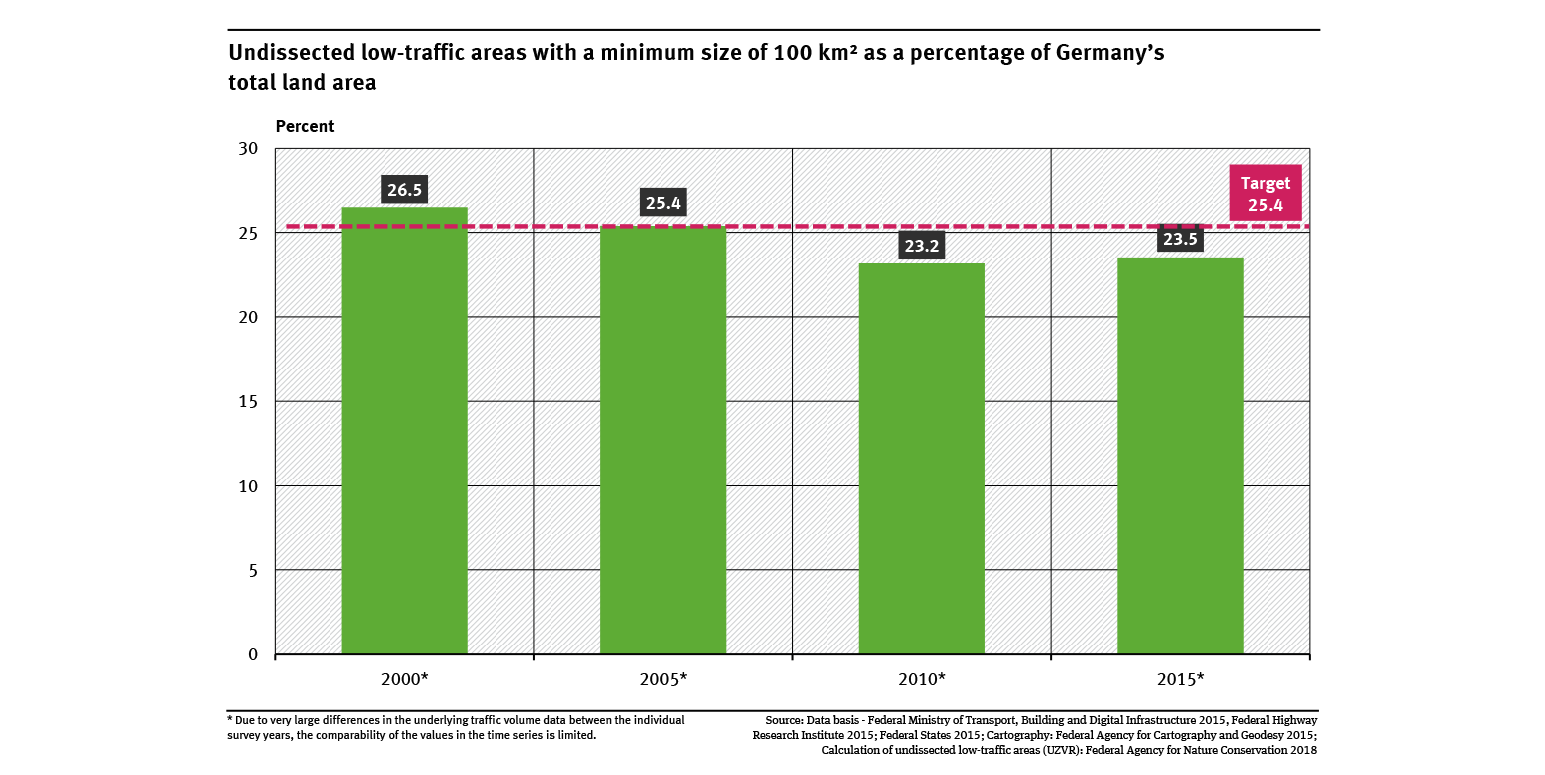
Undissected low-traffic areas with a minimum size of 100 km² as a percentage of Germany’s ...

  • Fläche, Boden, Land-Ökosysteme
  • Diagramme
  • Umwelt-Indikatoren
  • Daten und Tabellen
Export data

You can also search in other data portals of the German Environment Agency

Short link: www.umweltbundesamt.de/n300701en