Data Search

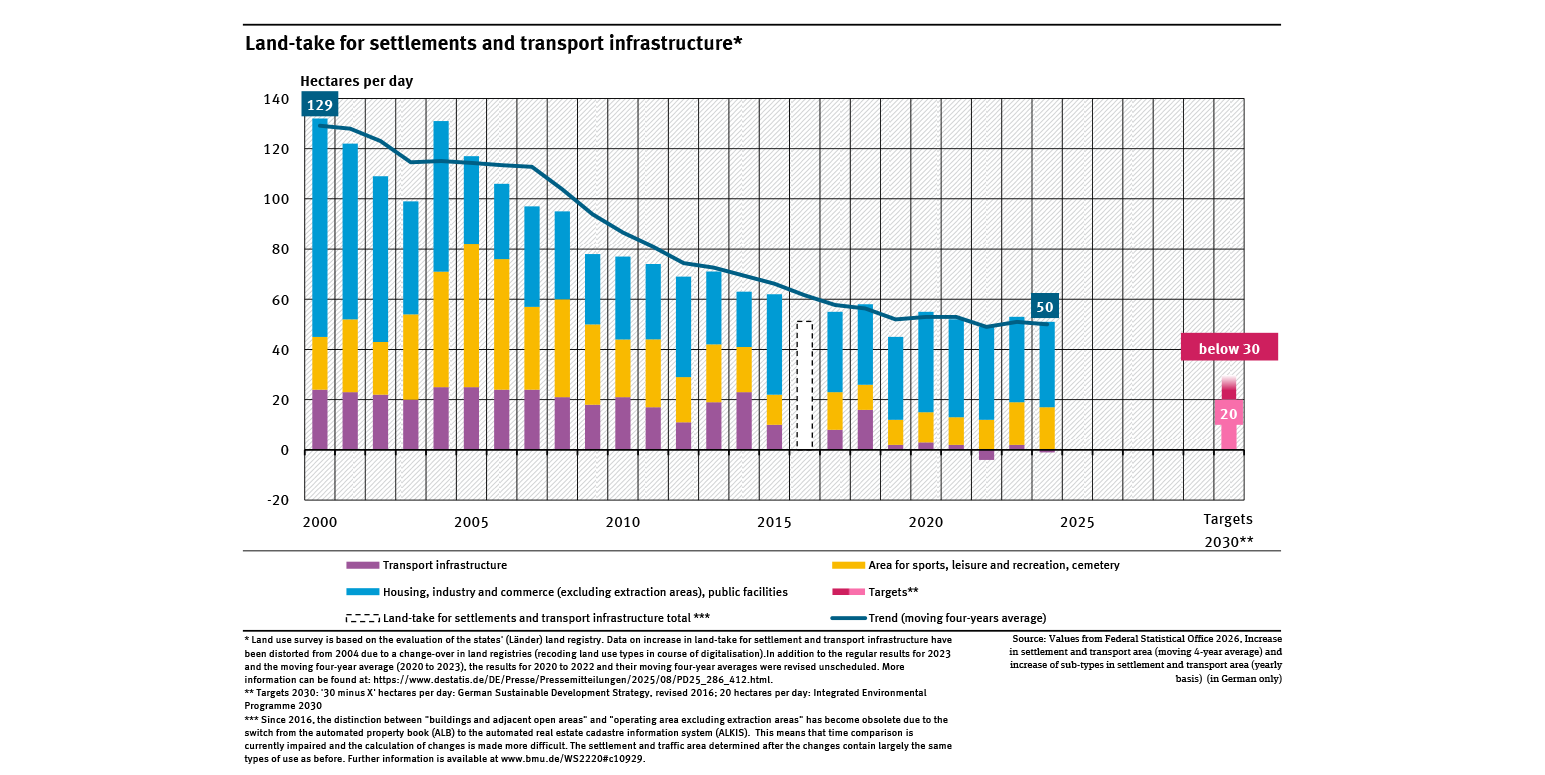
Land-take for settlements and transport infrastructure
- Fläche, Boden, Land-Ökosysteme
- Diagramme
- Umwelt-Indikatoren
- Daten und Tabellen

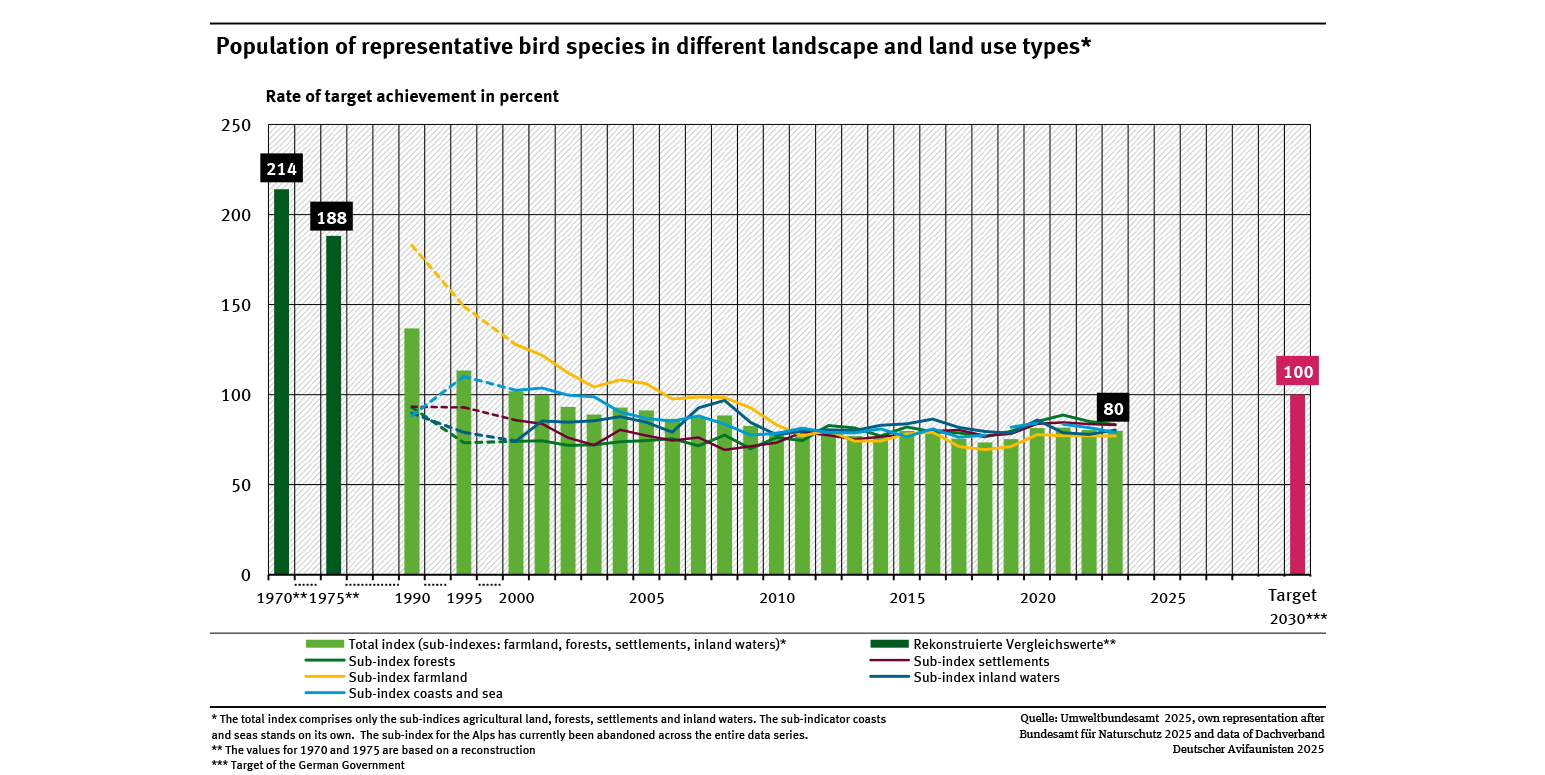
Population of representative bird species in different landscape and land use types
- Fläche, Boden, Land-Ökosysteme
- Diagramme
- Umwelt-Indikatoren
- Daten und Tabellen

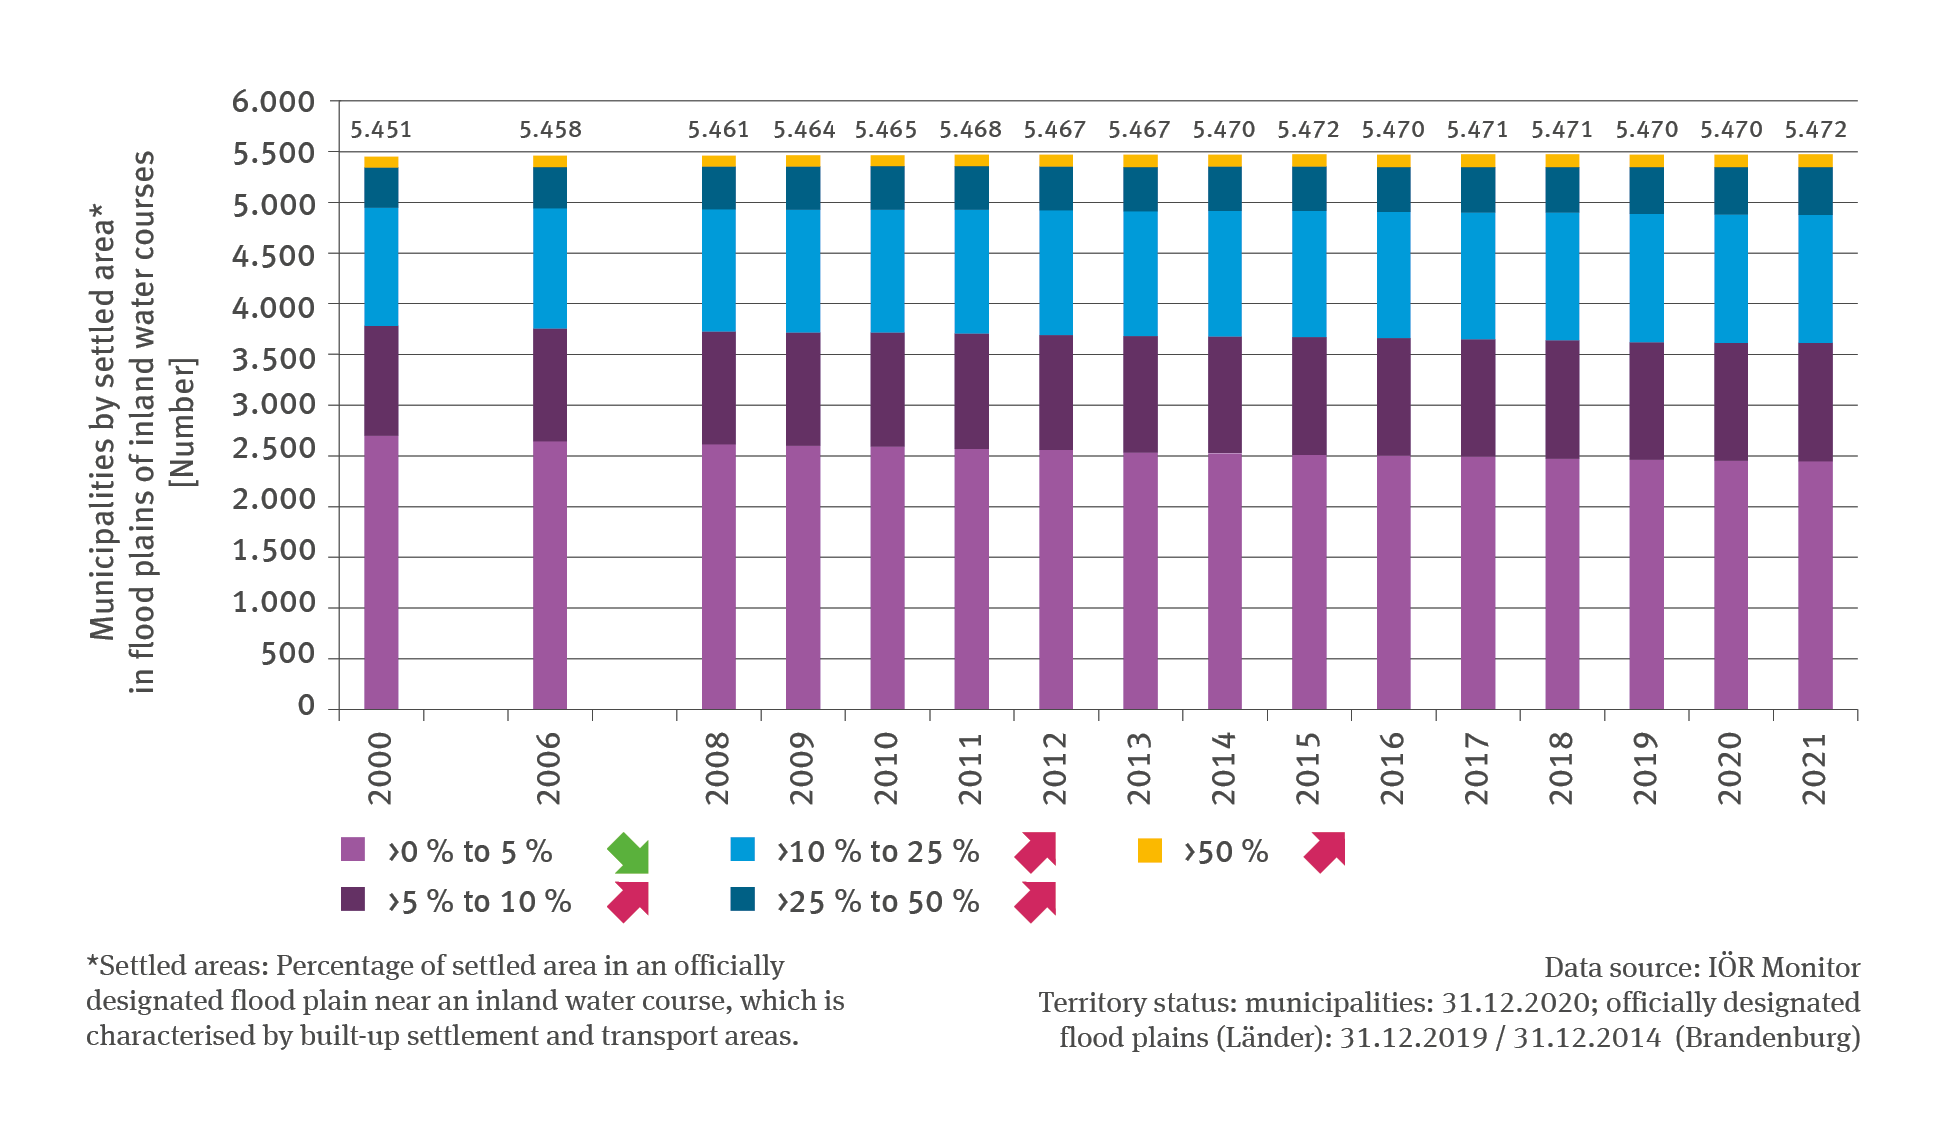
RO-R-6: Land use for settlements in officially designated flood plains
- Klima
- Fläche, Boden, Land-Ökosysteme
- Diagramme
Export data

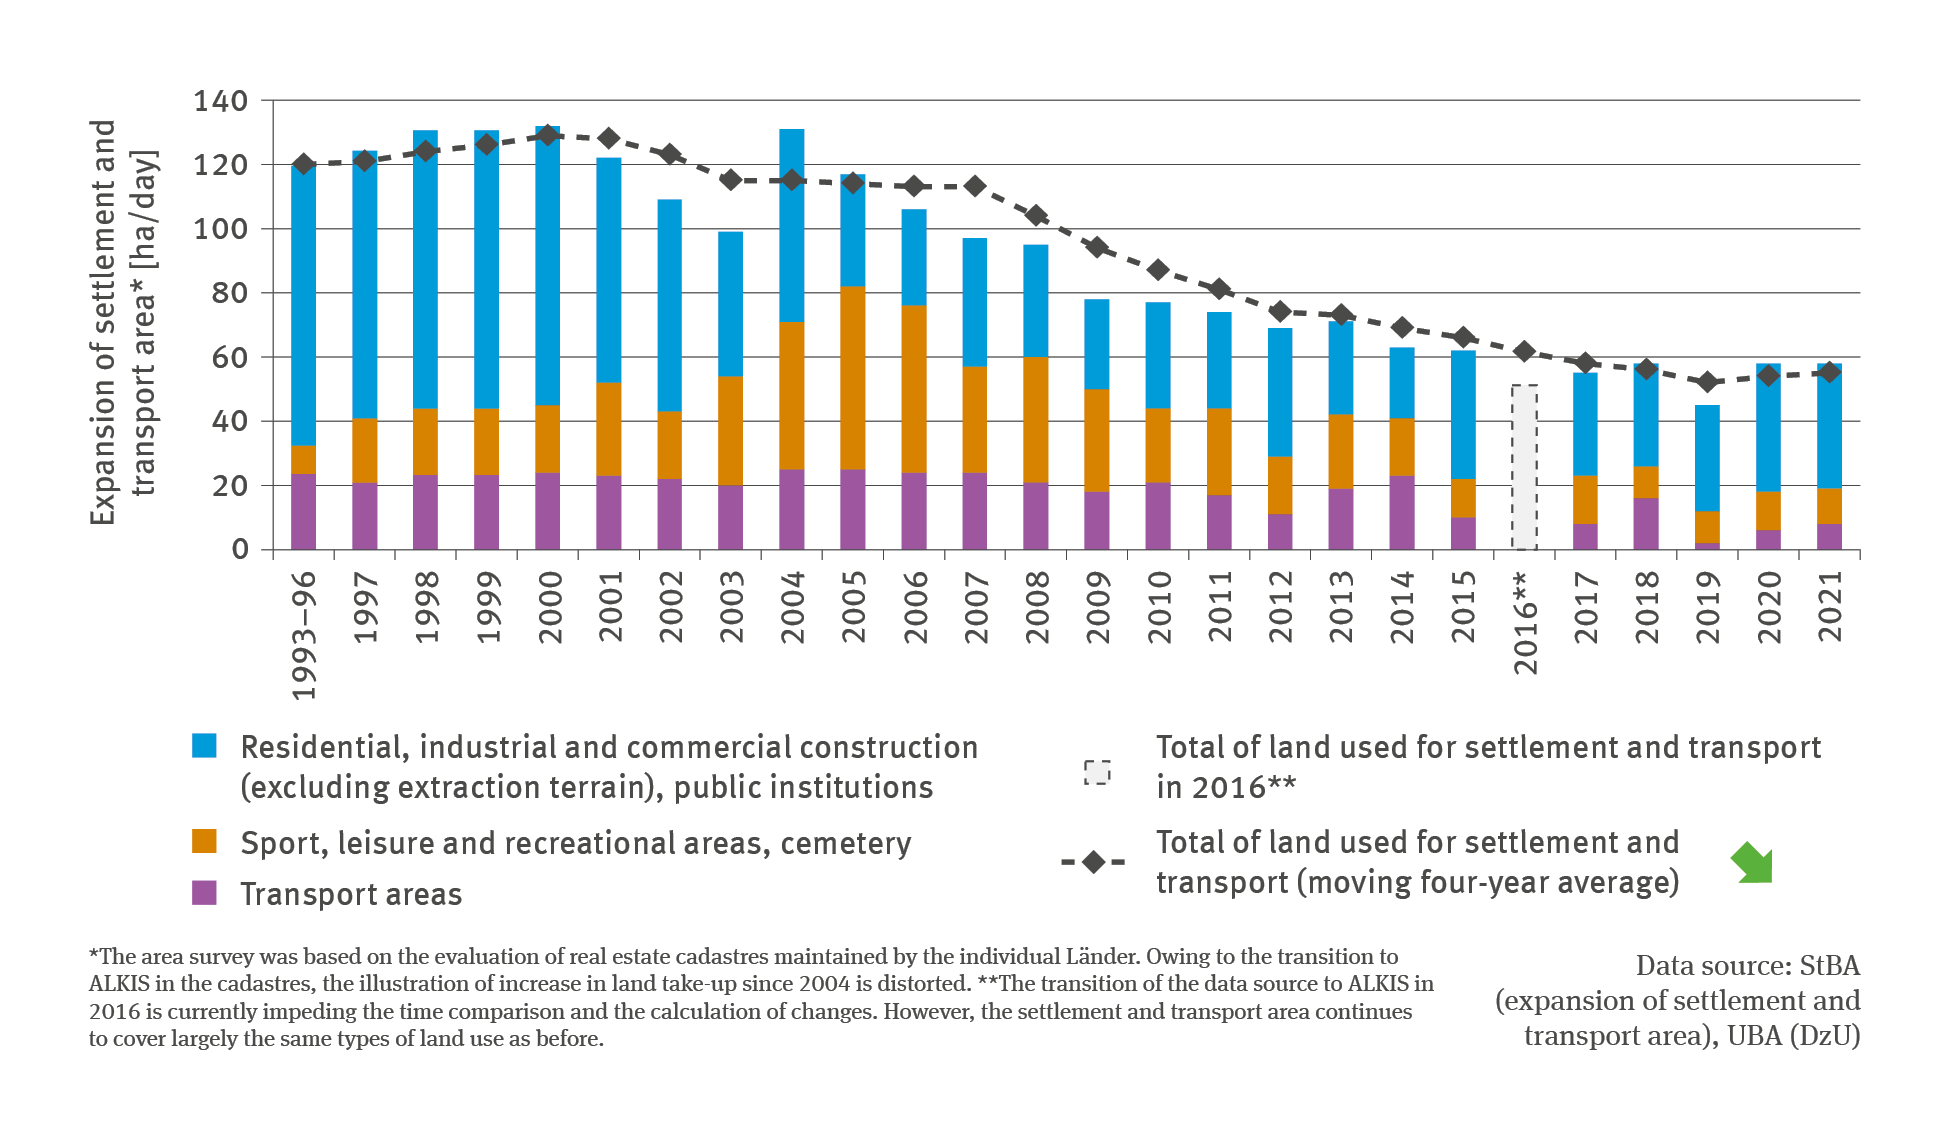
RO-R-5: Increase in settlement and transport areas
- Klima
- Fläche, Boden, Land-Ökosysteme
- Verkehr
- Diagramme
Export data

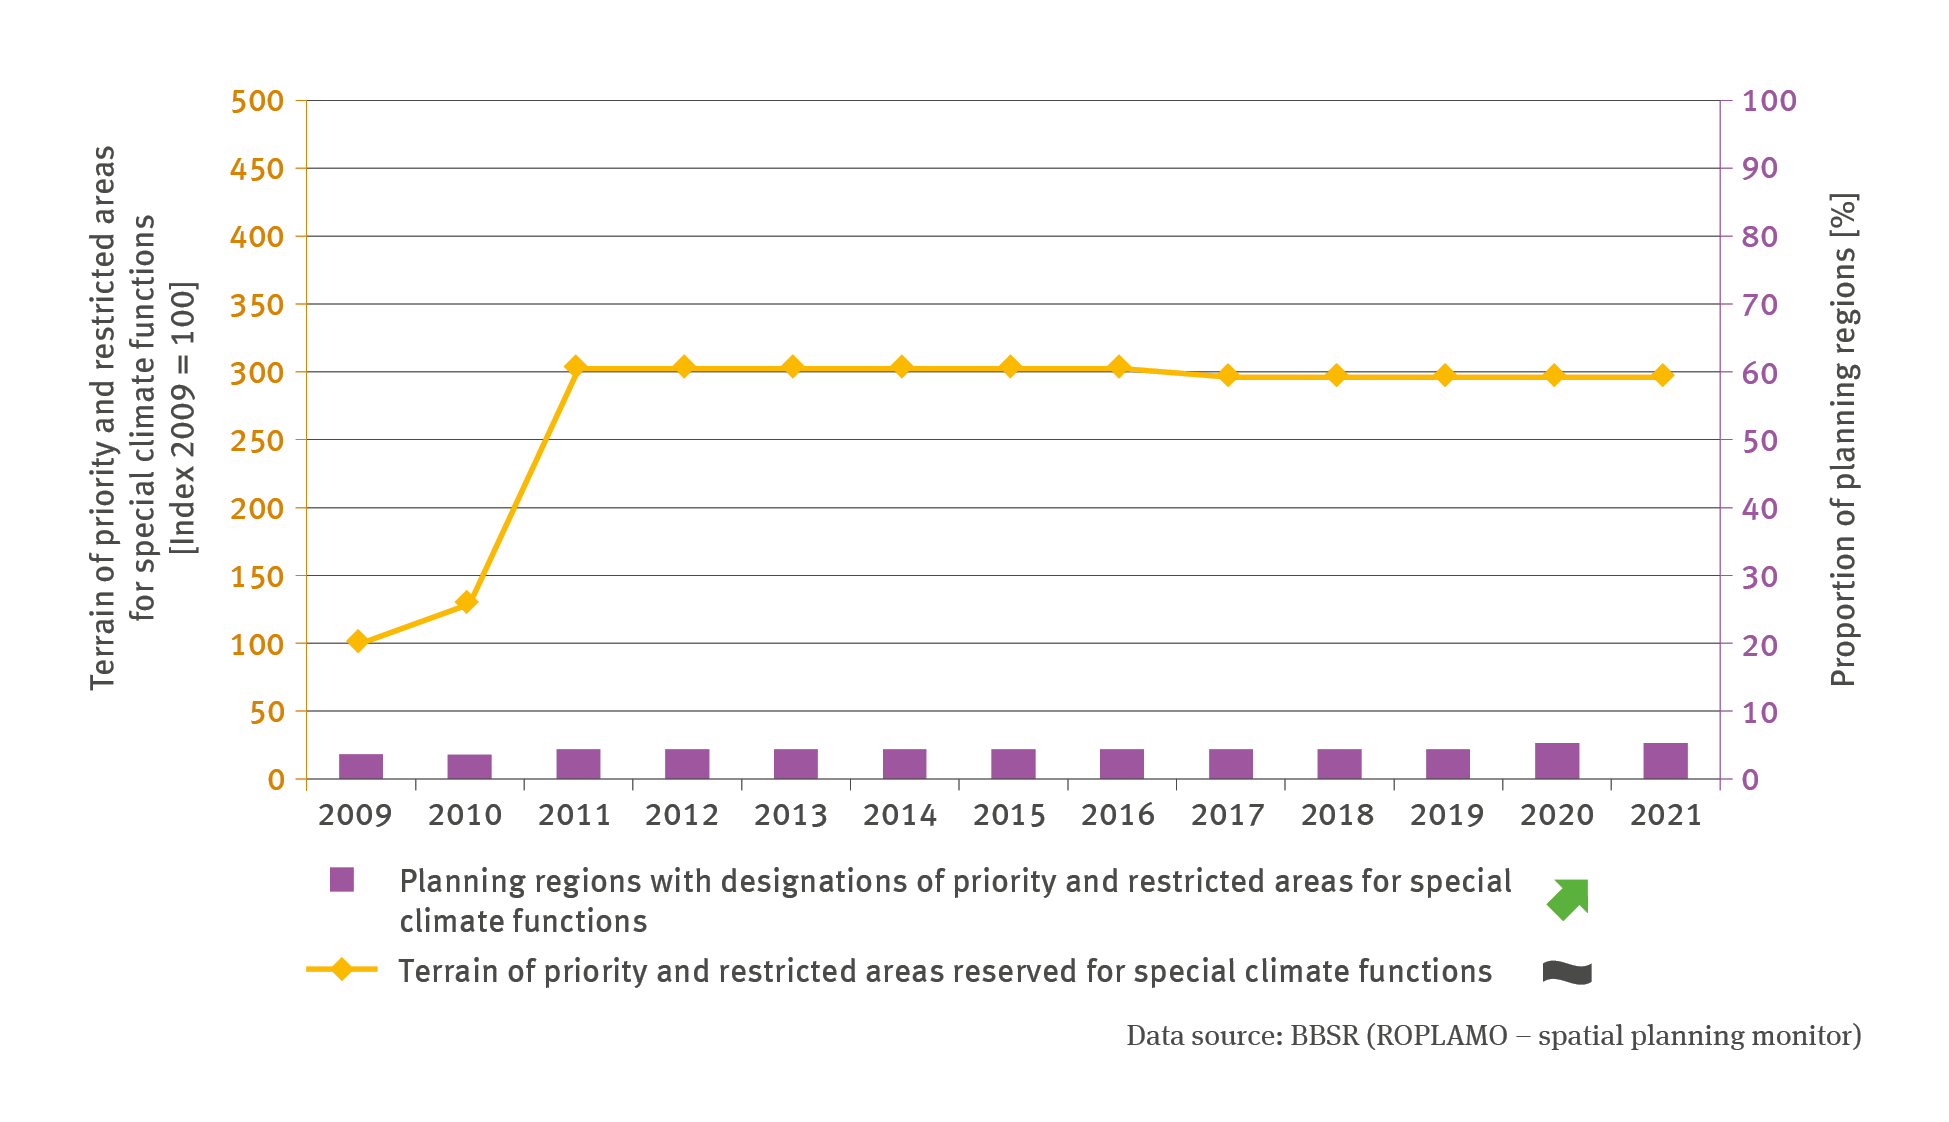
RO-R-4: Priority and restricted areas reserved for special climate functions
- Klima
- Fläche, Boden, Land-Ökosysteme
- Diagramme
Export data

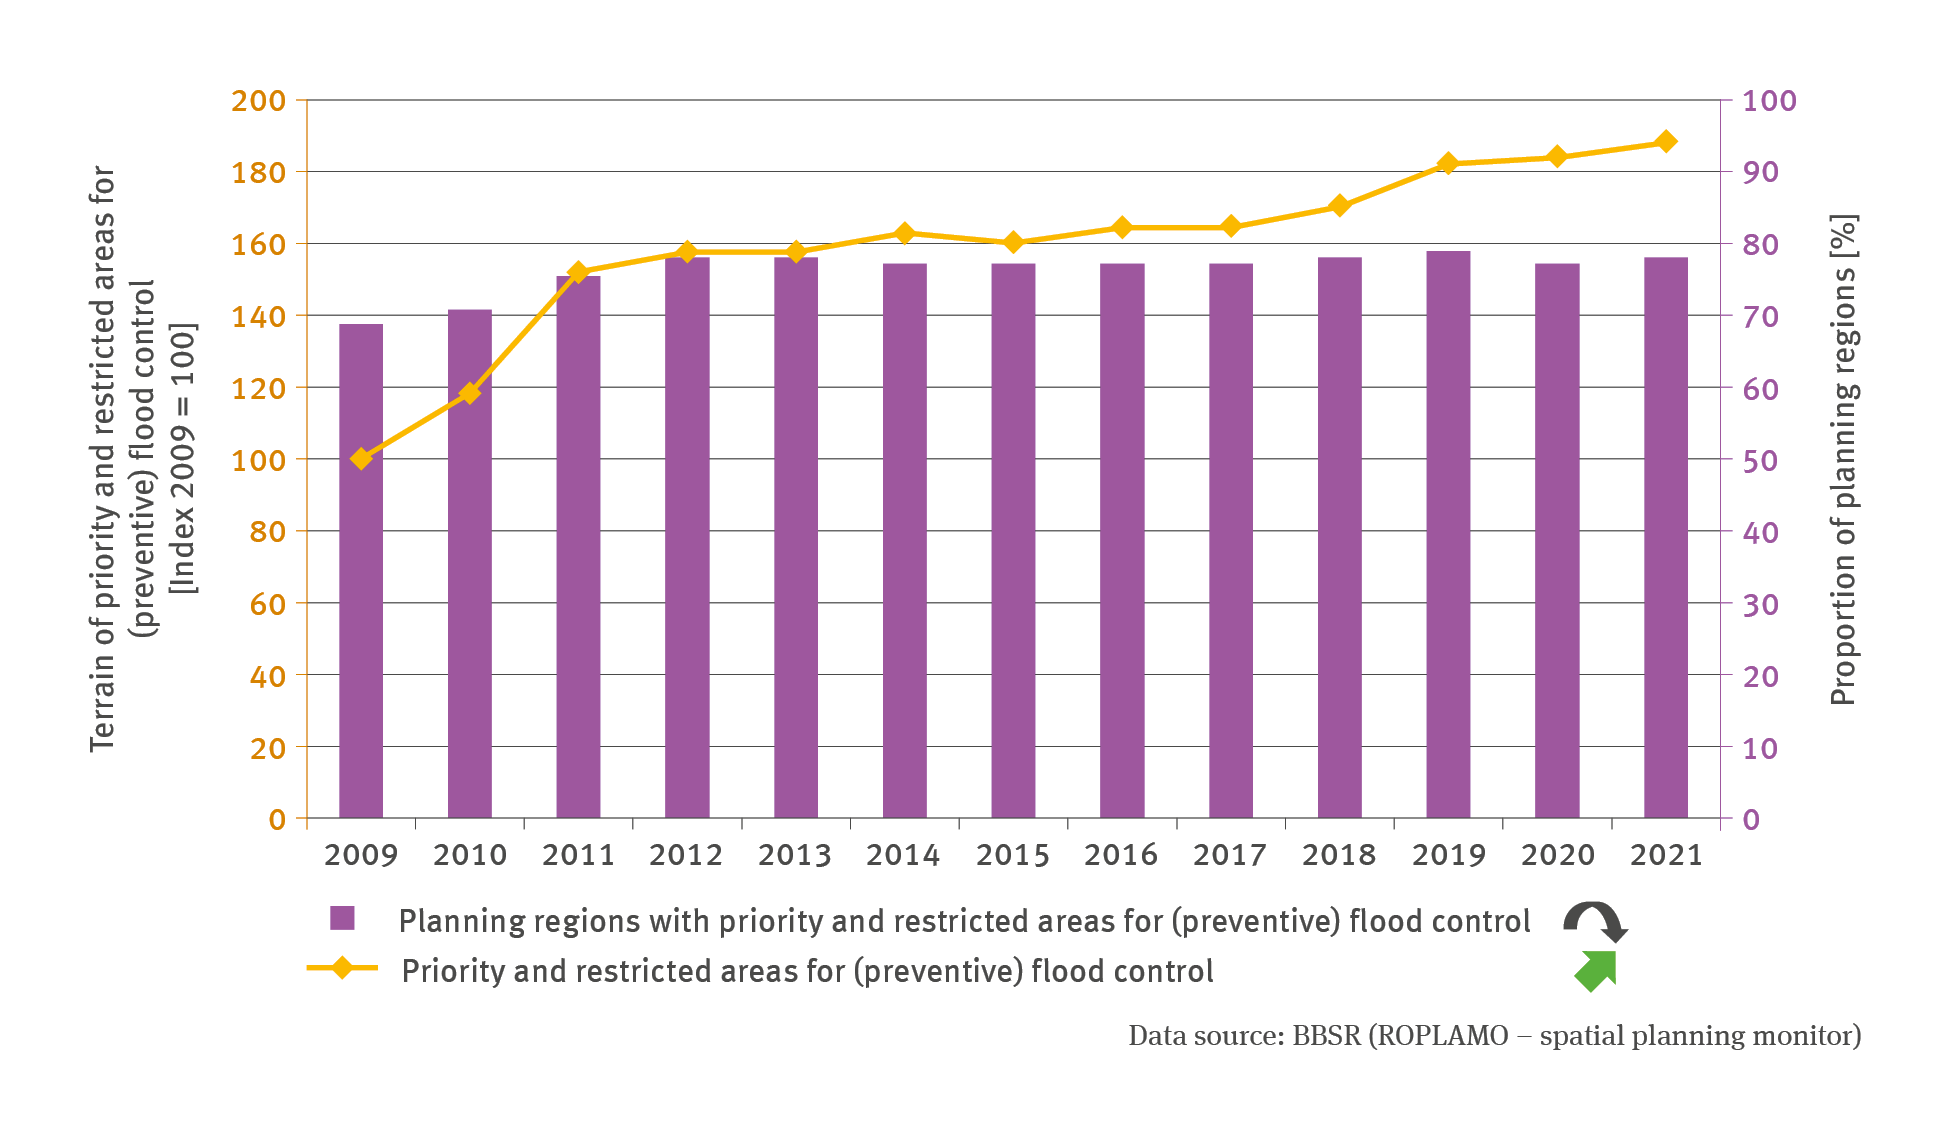
RO-R-3: Priority and restricted areas for (preventive) flood control
- Klima
- Fläche, Boden, Land-Ökosysteme
- Wasser
- Diagramme
Export data

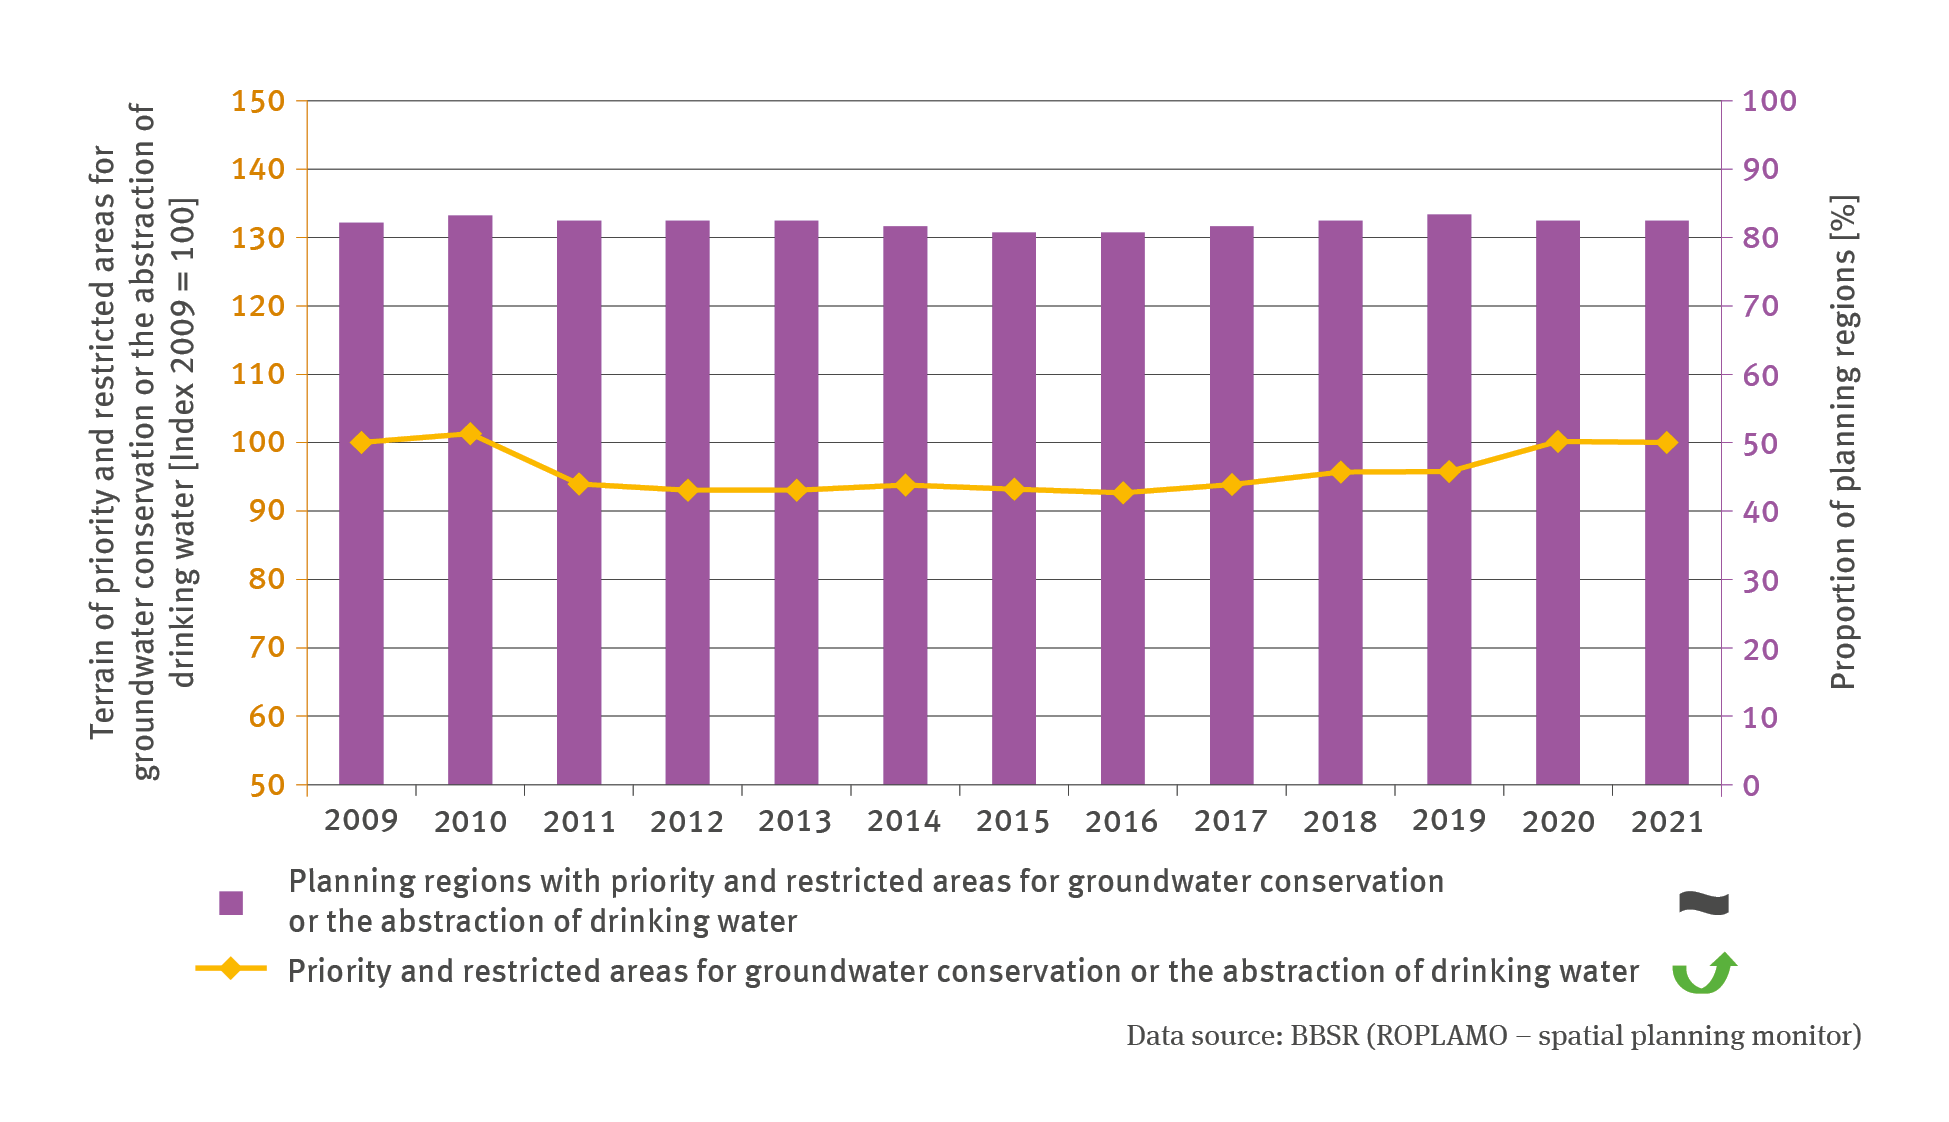
RO-R-2: Priority and reserved areas groundwater / drinking water
- Klima
- Fläche, Boden, Land-Ökosysteme
- Wasser
- Diagramme
Export data

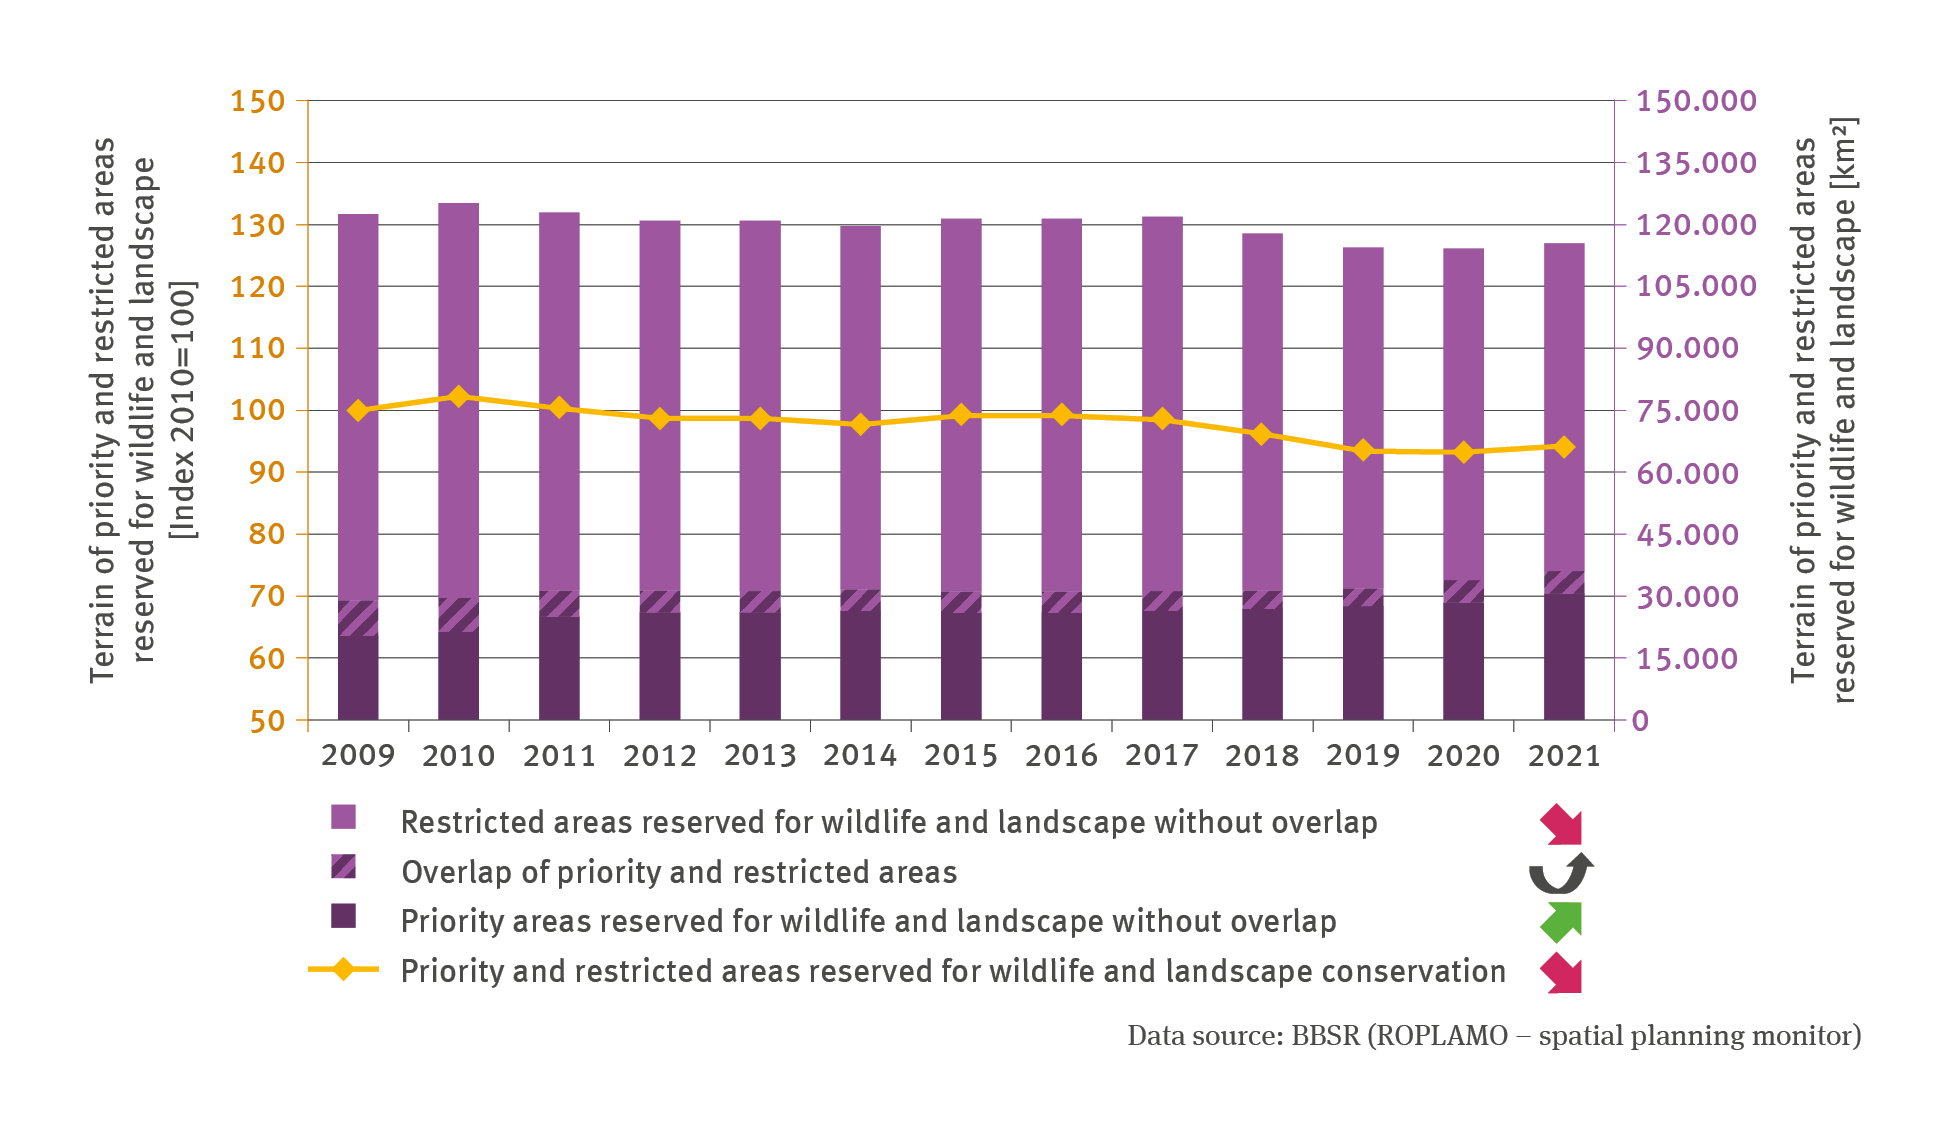
RO-R-1: Priority and restricted areas reserved for wildlife and landscape conservation
- Klima
- Fläche, Boden, Land-Ökosysteme
- Diagramme
Export data

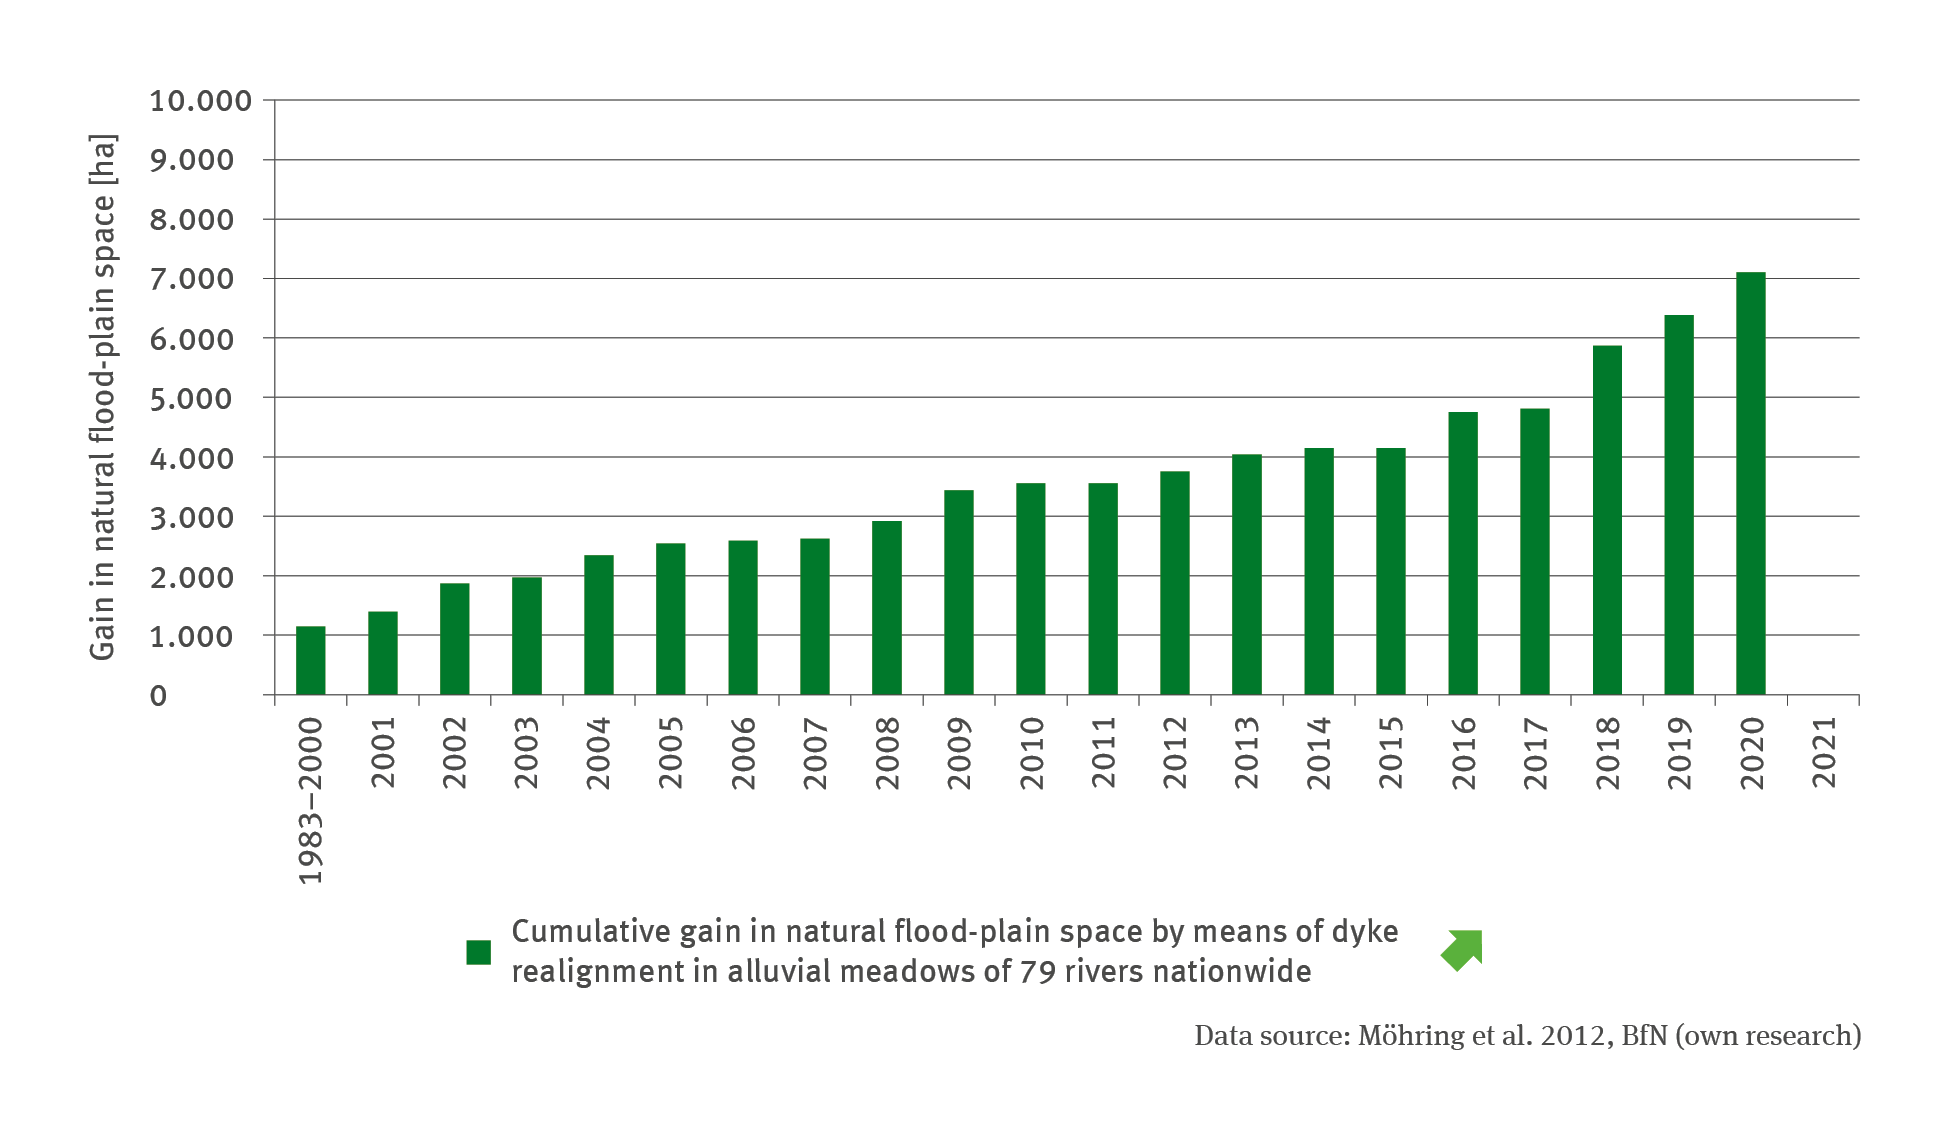
BD-R-2: Restoration of natural flood plains
- Klima
- Fläche, Boden, Land-Ökosysteme
- Diagramme
Export data

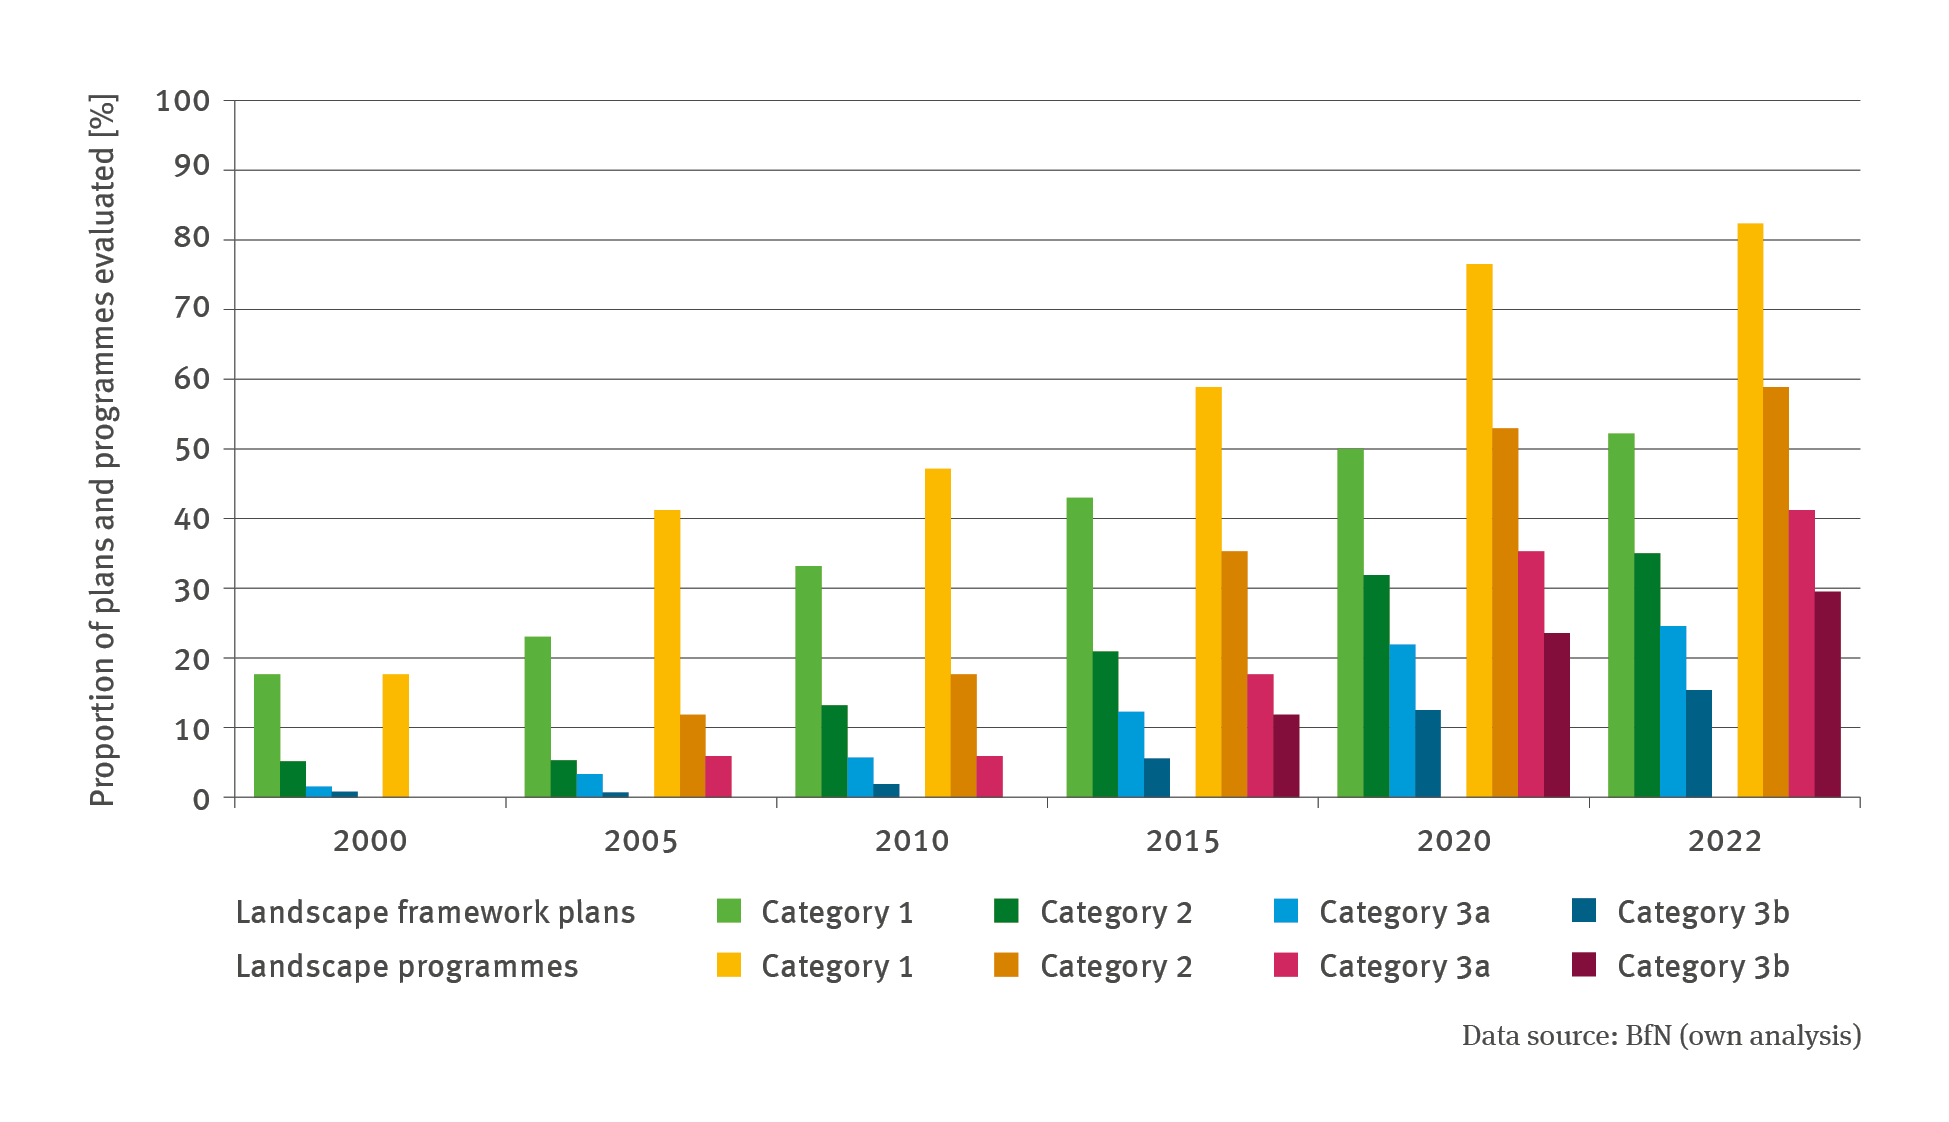
BD-R-1: Consideration of climate change in landscape programmes
- Klima
- Fläche, Boden, Land-Ökosysteme
- Diagramme
Export data