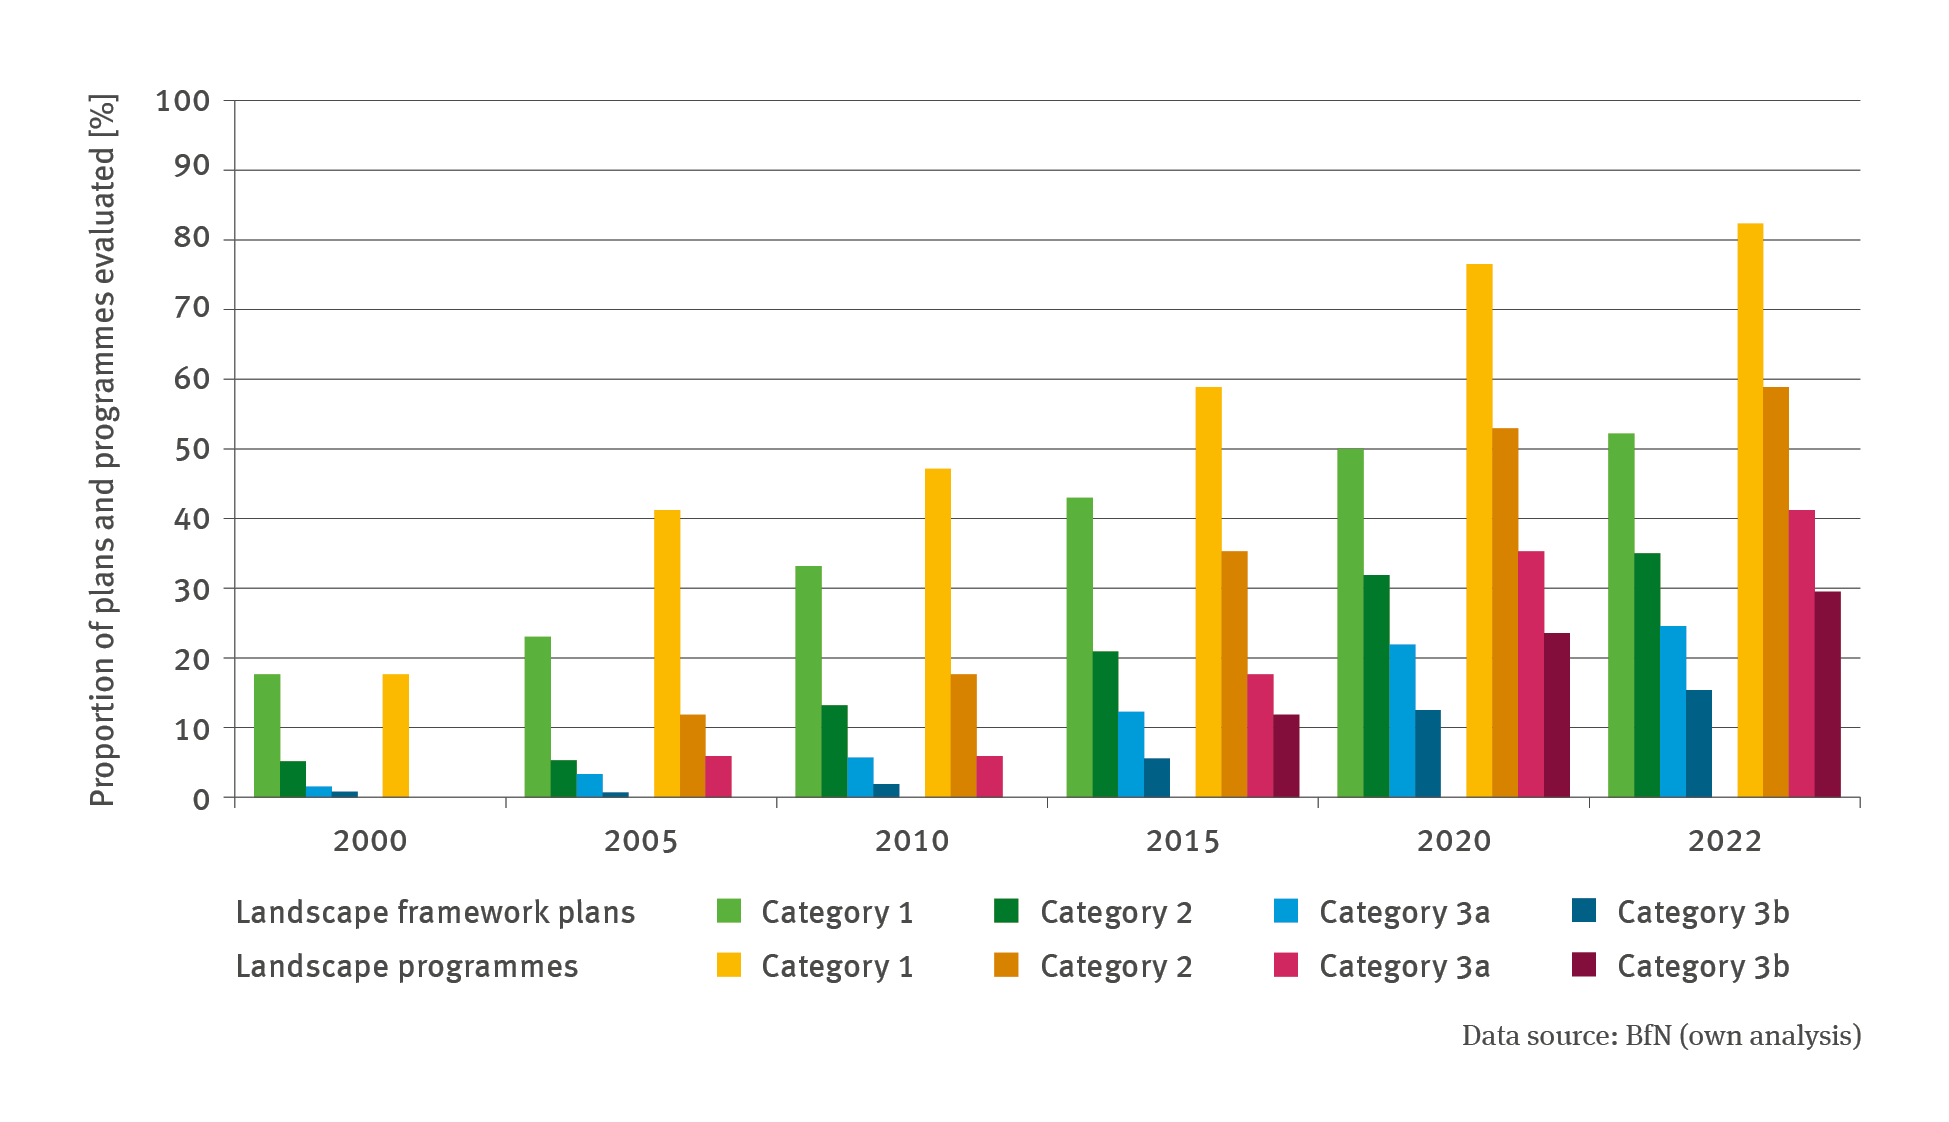
Skip to main content Skip to main menu Skip to footer

Data Search

Data Search

Here you will find diagrams, infographics, maps and tables for direct download.

Data Search

The illustration BD-I-3 ’Temperature index of butterfly species communities’ contains a line chart indicating the temperature index of butterfly species communities in degrees Celsius. In the illustrated period of 2006 to 2021 the line rises significantly. While the index for 2006 amounted to approximately 8.9 degrees Celsius, in 2021 the value amounted to approximately 9.1 degrees Celsius. However, the increase did not proceed continuously. In 2010 and 2011, the index value dropped, and also in 2017, the v

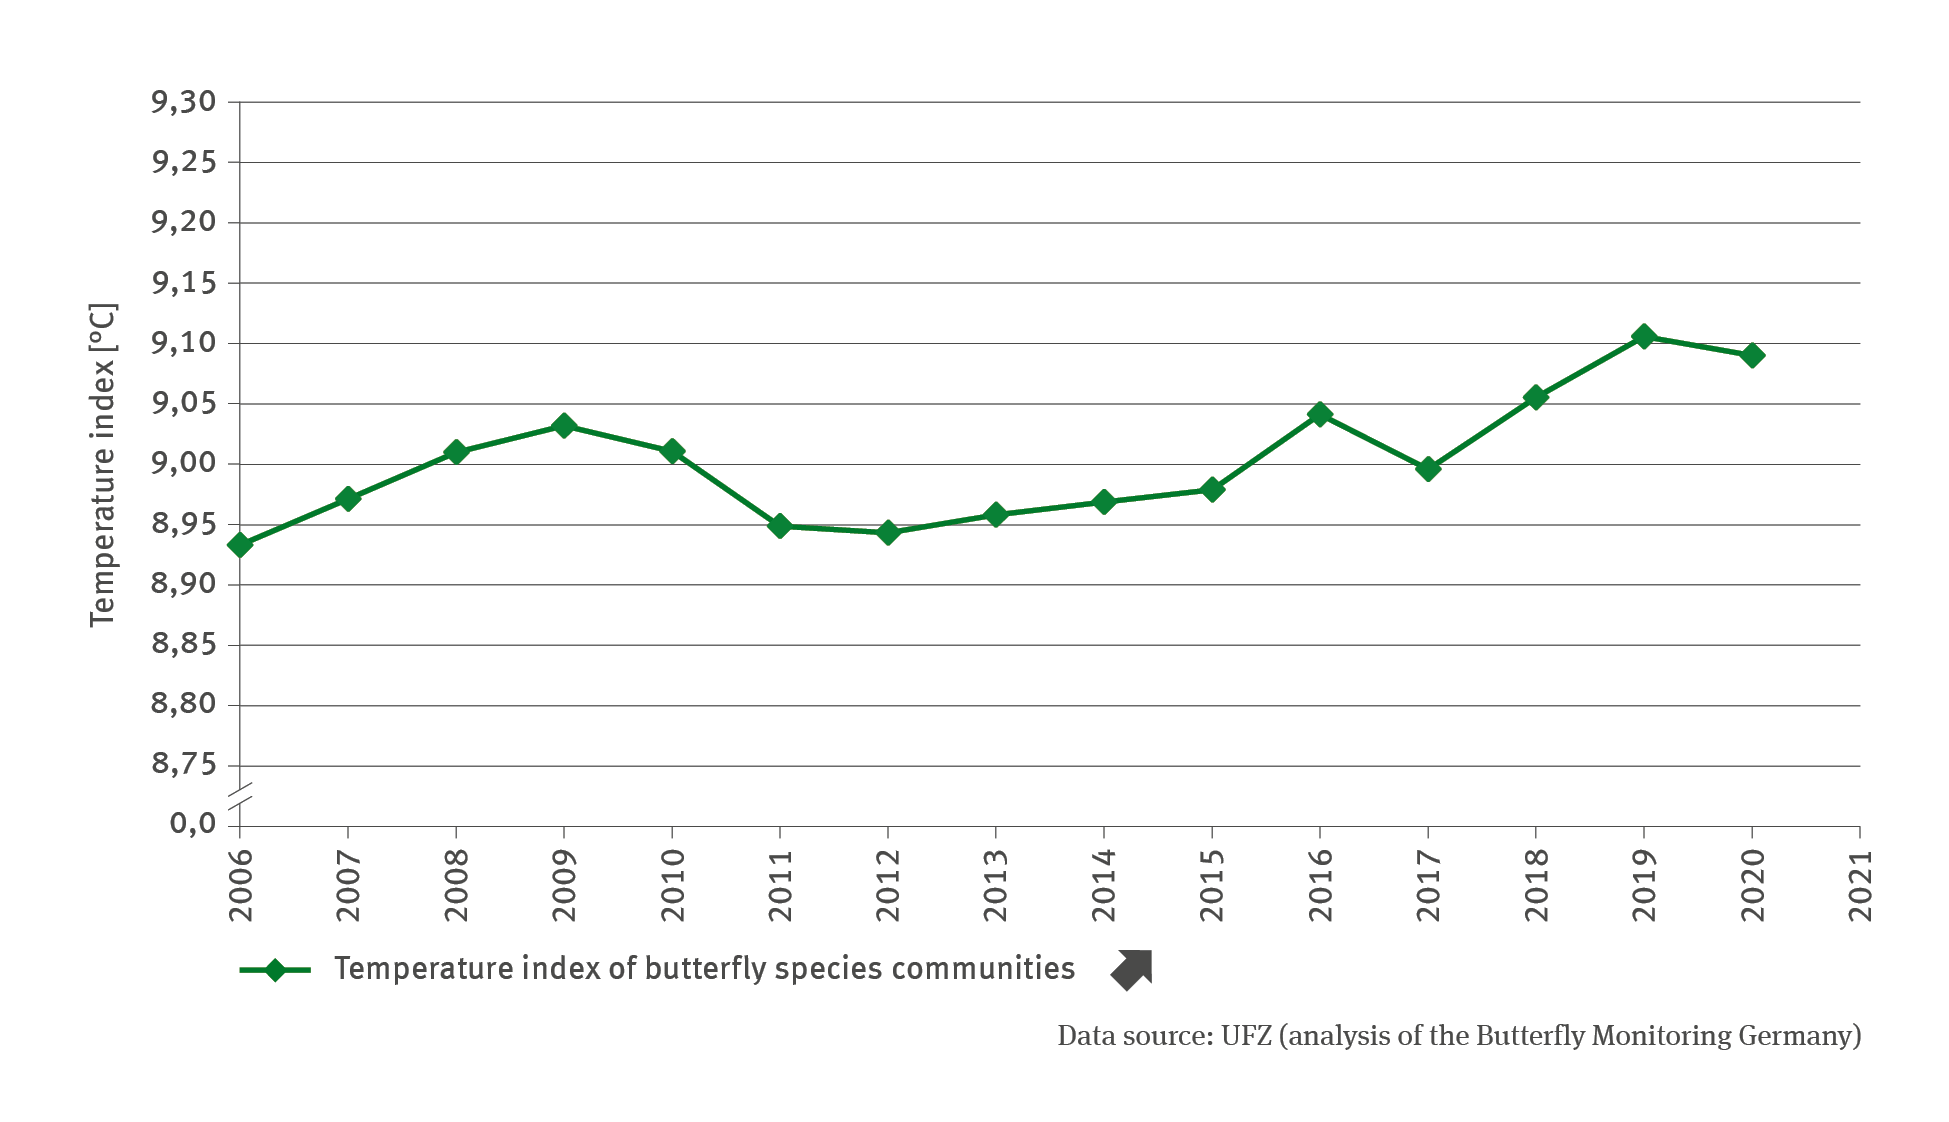
BD-I-3: Temperature index of butterfly species communities

  • Klima
  • Fläche, Boden, Land-Ökosysteme
  • Diagramme
Export data
PNG
The illustration BD-I-2 ’Temperature index for bird species communities’ is a line chart with two lines. The first line shows the annual temperature index of frequently occurring breeding bird species for the period 1990 to 2021. The index value shows a significantly rising trend and has increased from 12.14 degrees Celsius in 1990 to 12.40 degrees Celsius in 2021. The second line illustrates the moving 5-year average. Here too the trend is rising significantly.

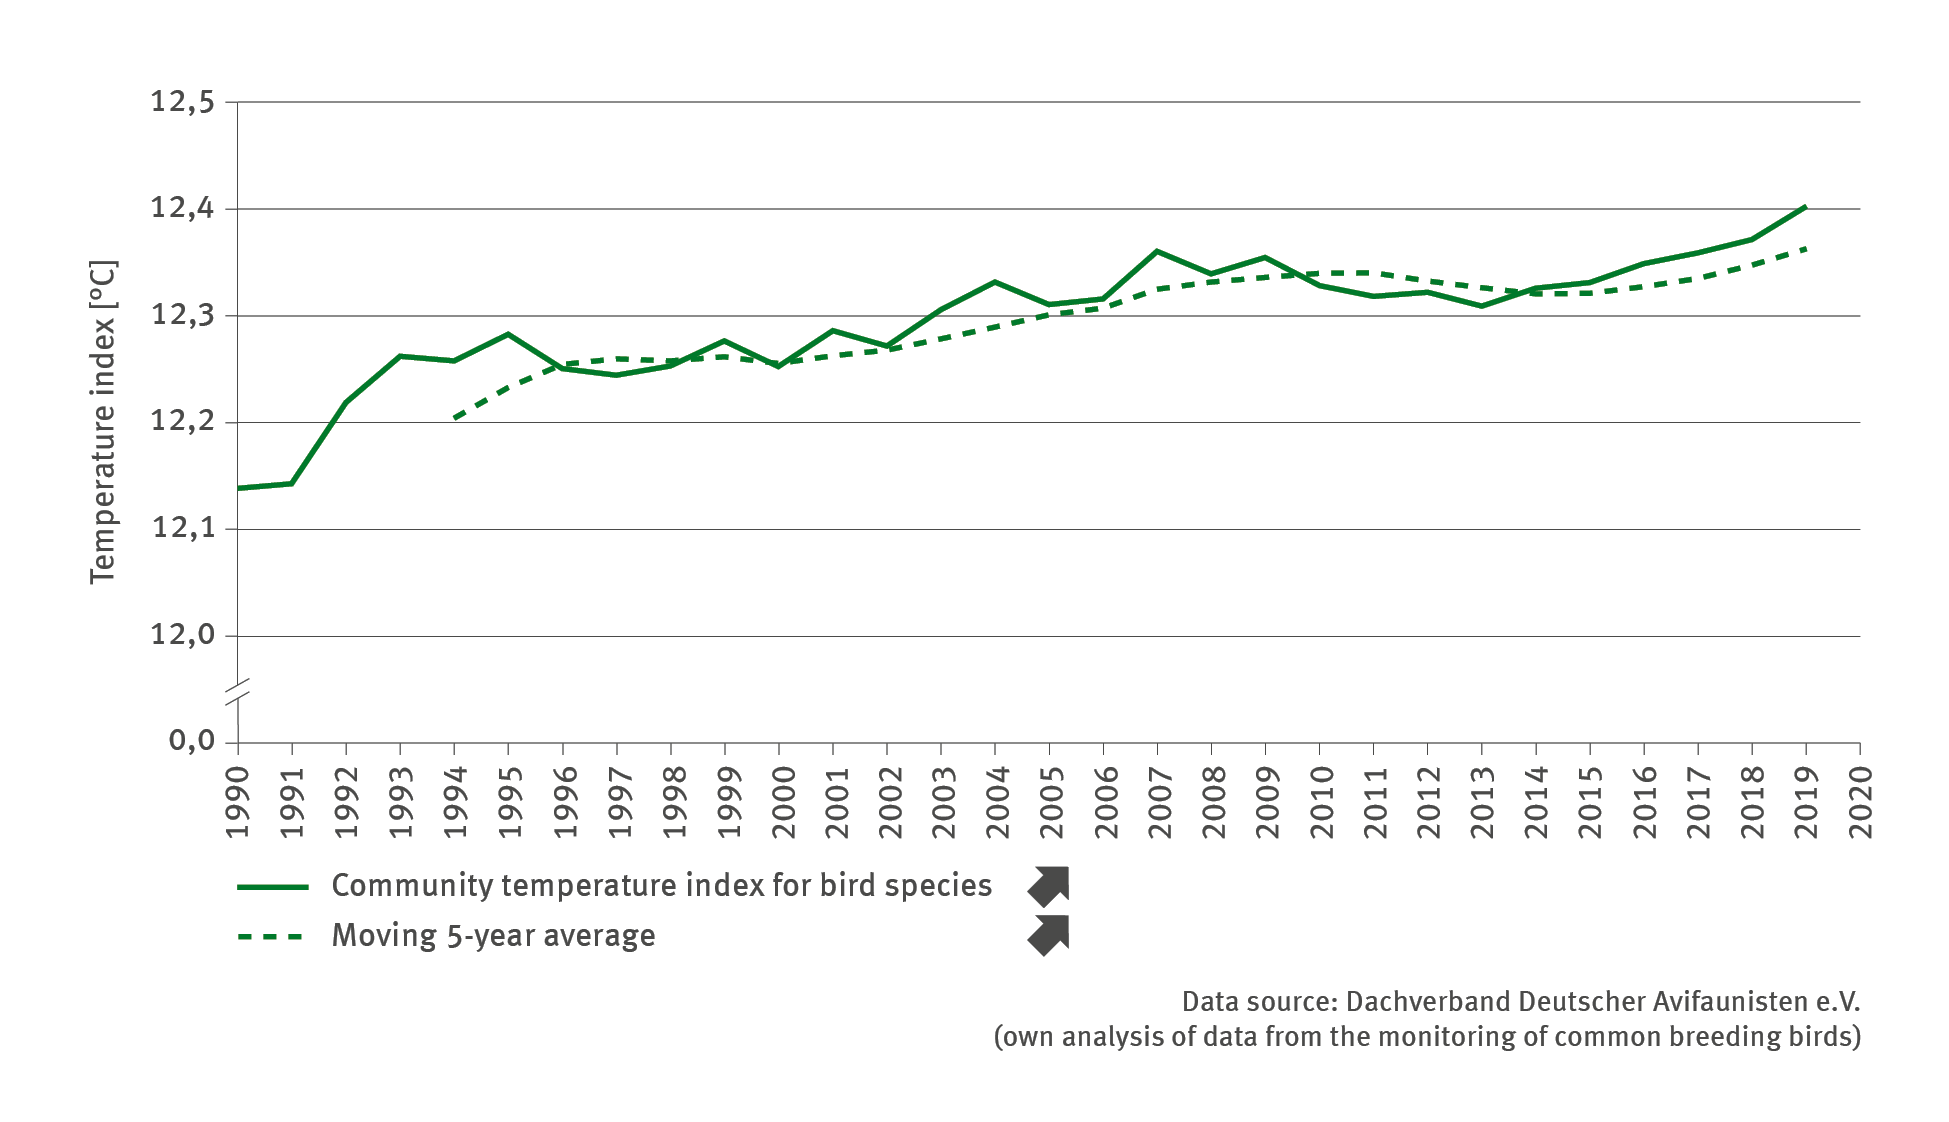
BD-I-2: Temperature index for bird species communities

  • Klima
  • Fläche, Boden, Land-Ökosysteme
  • Diagramme
Export data
PNG
The illustration contains a stacked column chart which shows the beginning and duration of the phenological seasons for the periods of 1951 to 1980, 1981 to 2010 and 1992 to 2021. This demonstrates that, by comparison, winter has become shorter which also applies to spring and high summer. The early summer has become longer by approximately two days.

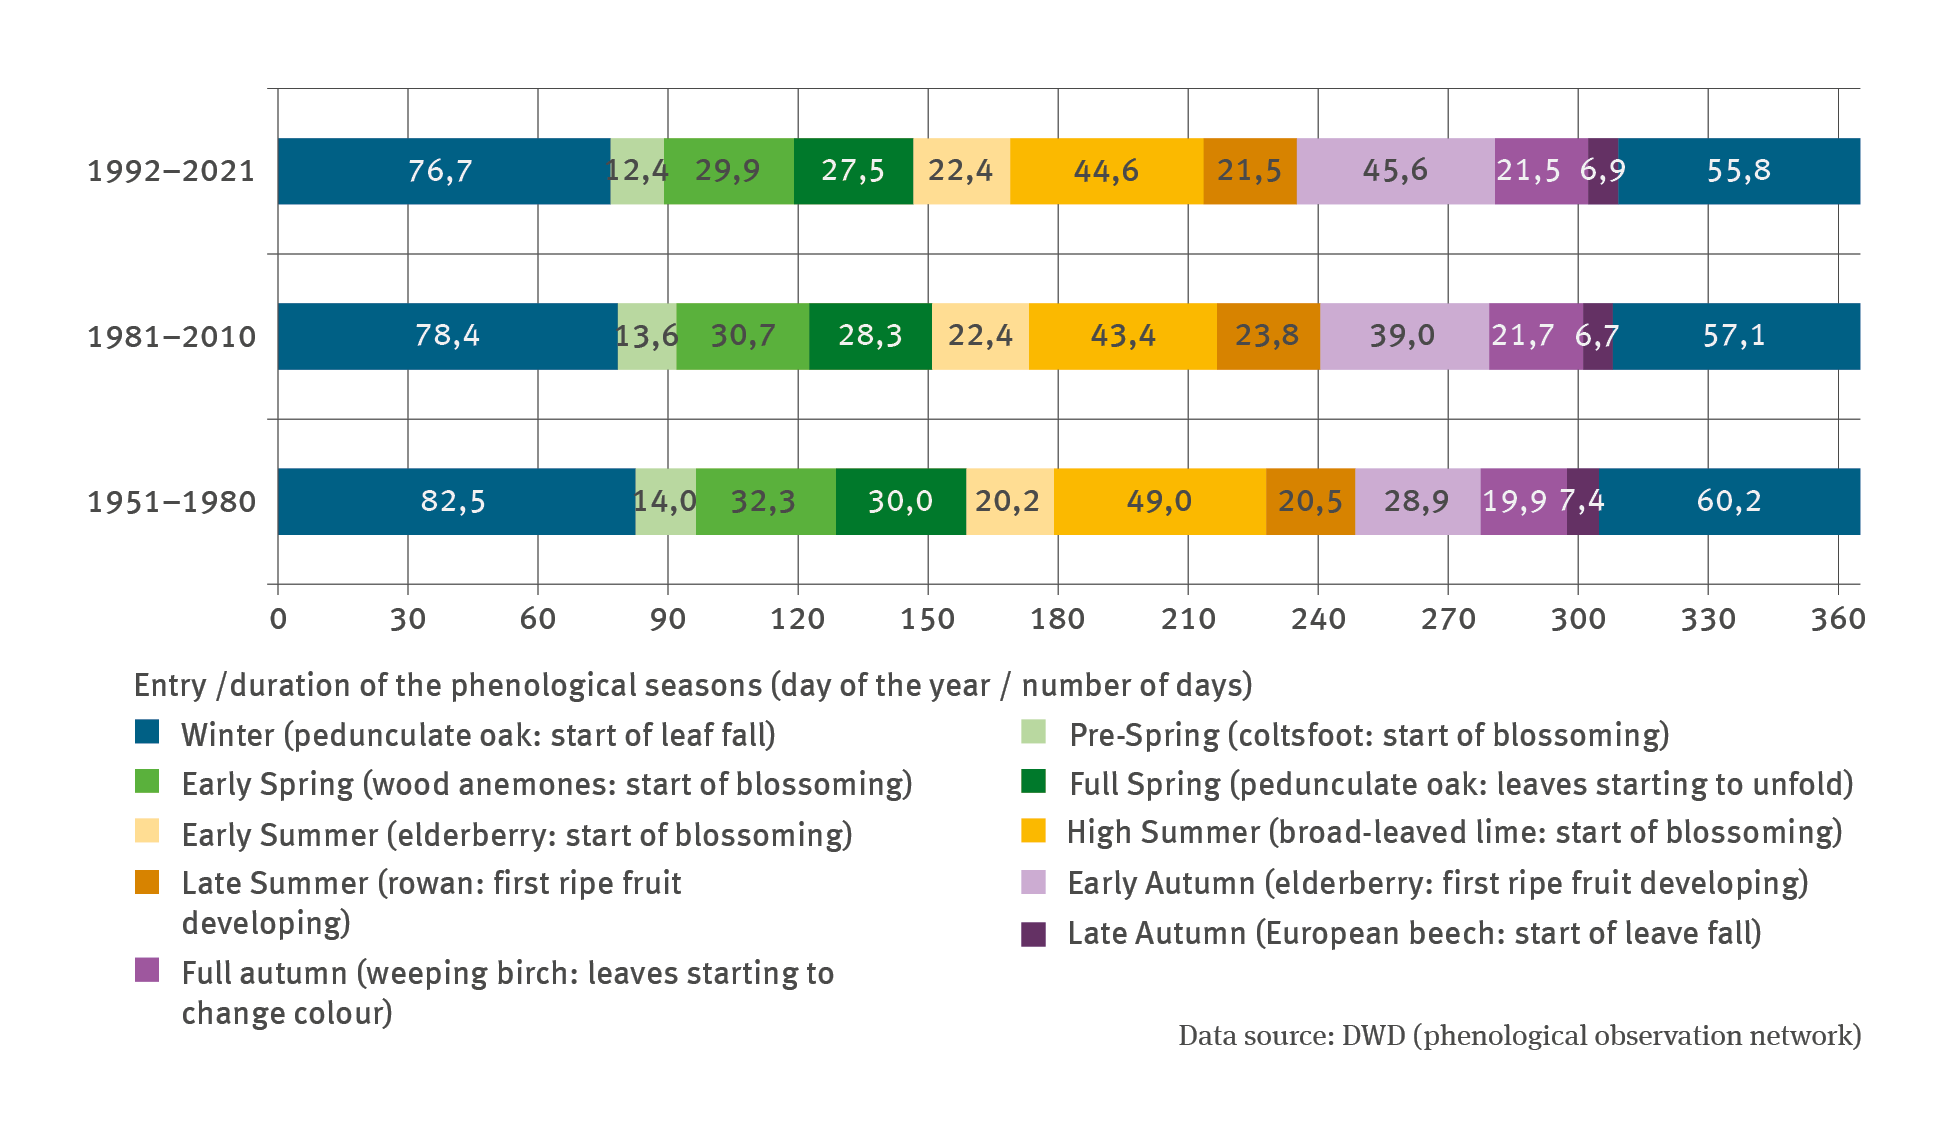
BD-I-1: Phenological changes in wild plant species

  • Klima
  • Fläche, Boden, Land-Ökosysteme
  • Diagramme
  • Infografiken
Export data
PNG
The biaxial chart FW-R-4 ’Utilisation of raw timber’ is divided into two thematic components. The upper part of the chart shows data on the utilisation of raw coniferous timber, whereas the lower part shows data on the utilisation of raw deciduous timber. The proportion of each type of subsequent utilisation compared to the total volume is indicated in stacked columns: material objects, energy production, exports, increase in storage.

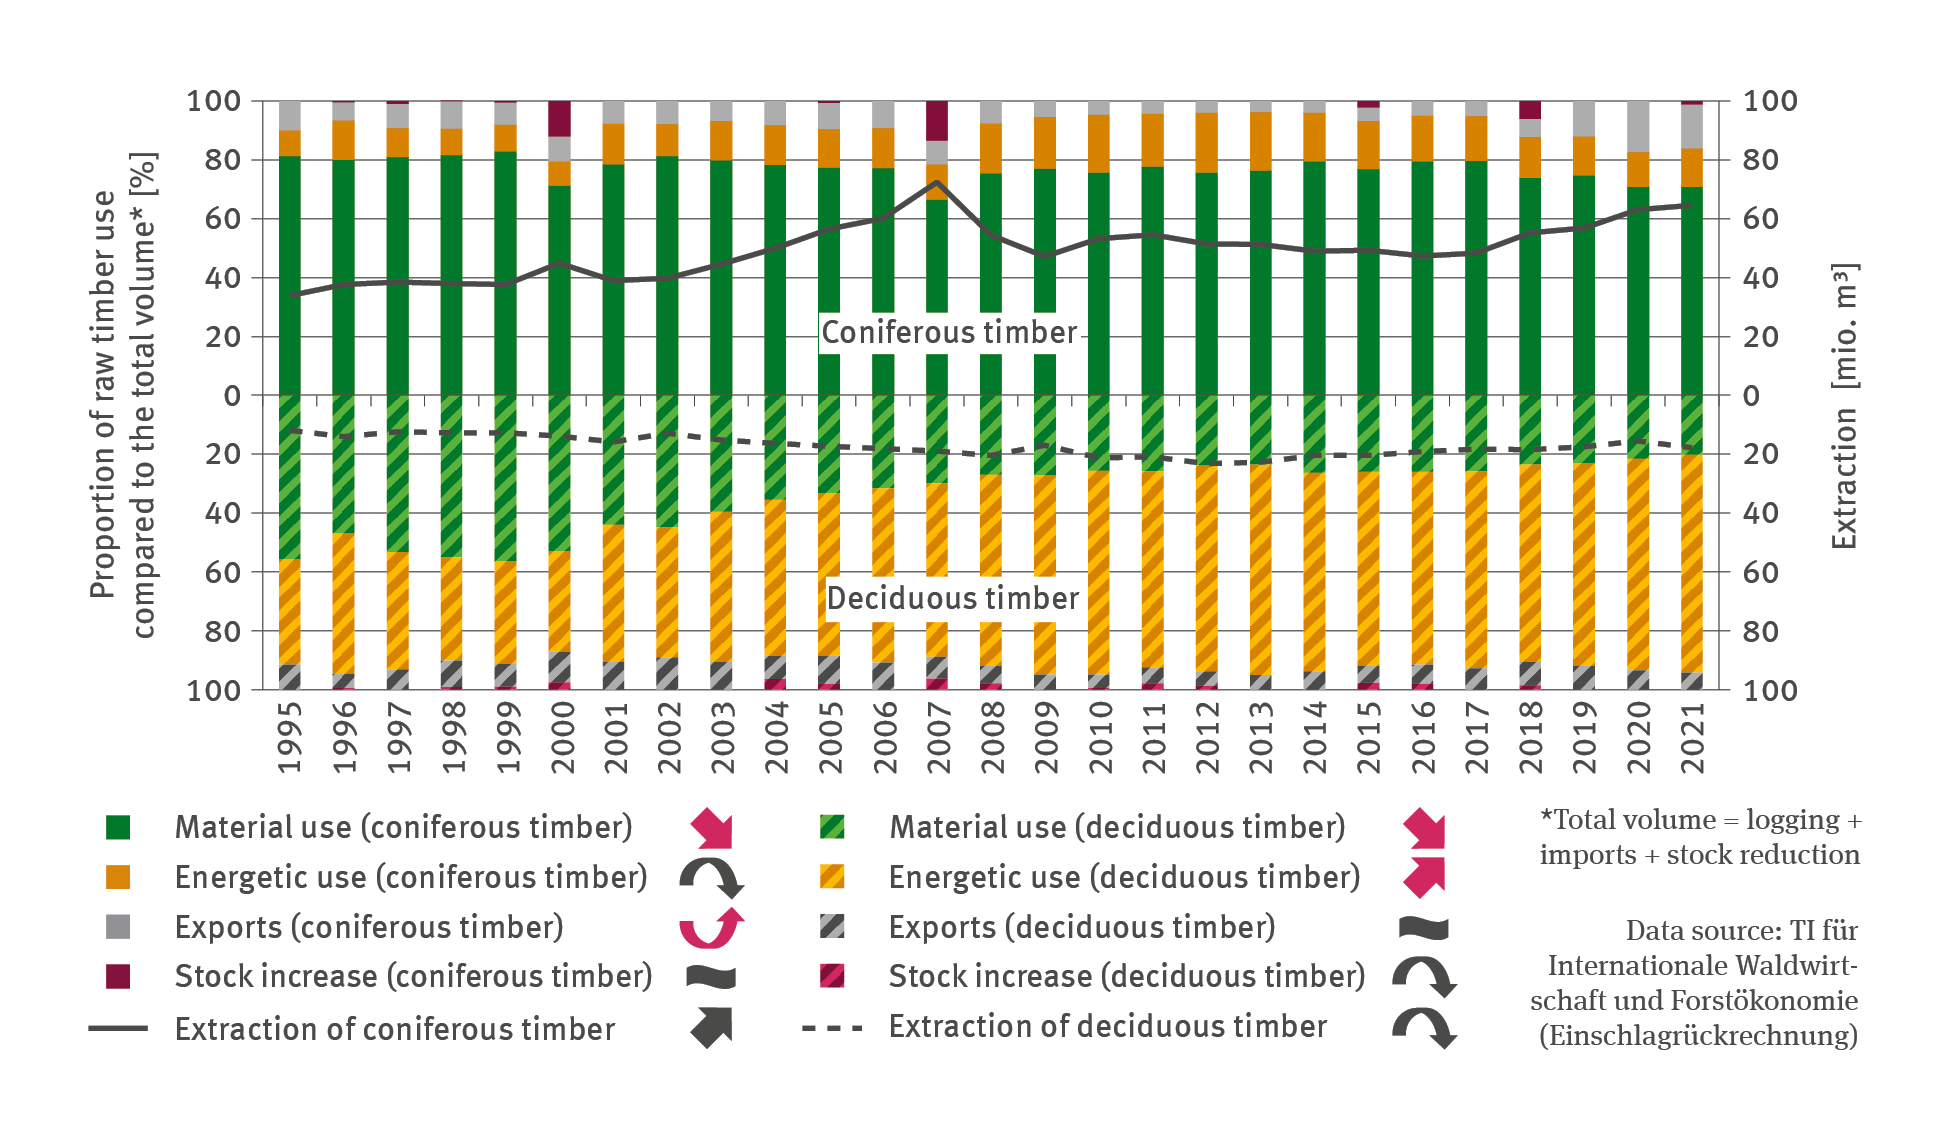
FW-R-4: Utilisation of raw timber

  • Klima
  • Fläche, Boden, Land-Ökosysteme
  • Land- und Forstwirtschaft
  • Diagramme
Export data
PNG
The illustration contains a biaxial chart. The terrain of permanent grassland is illustrated by means of bars, in units of 1,000 hectares. In addition, a line illustrates the proportion of permanent grassland compared to terrain in agricultural use. Both time series contain data for the years of 1991 to 2021 indicating a trend reversal towards a rising trend.

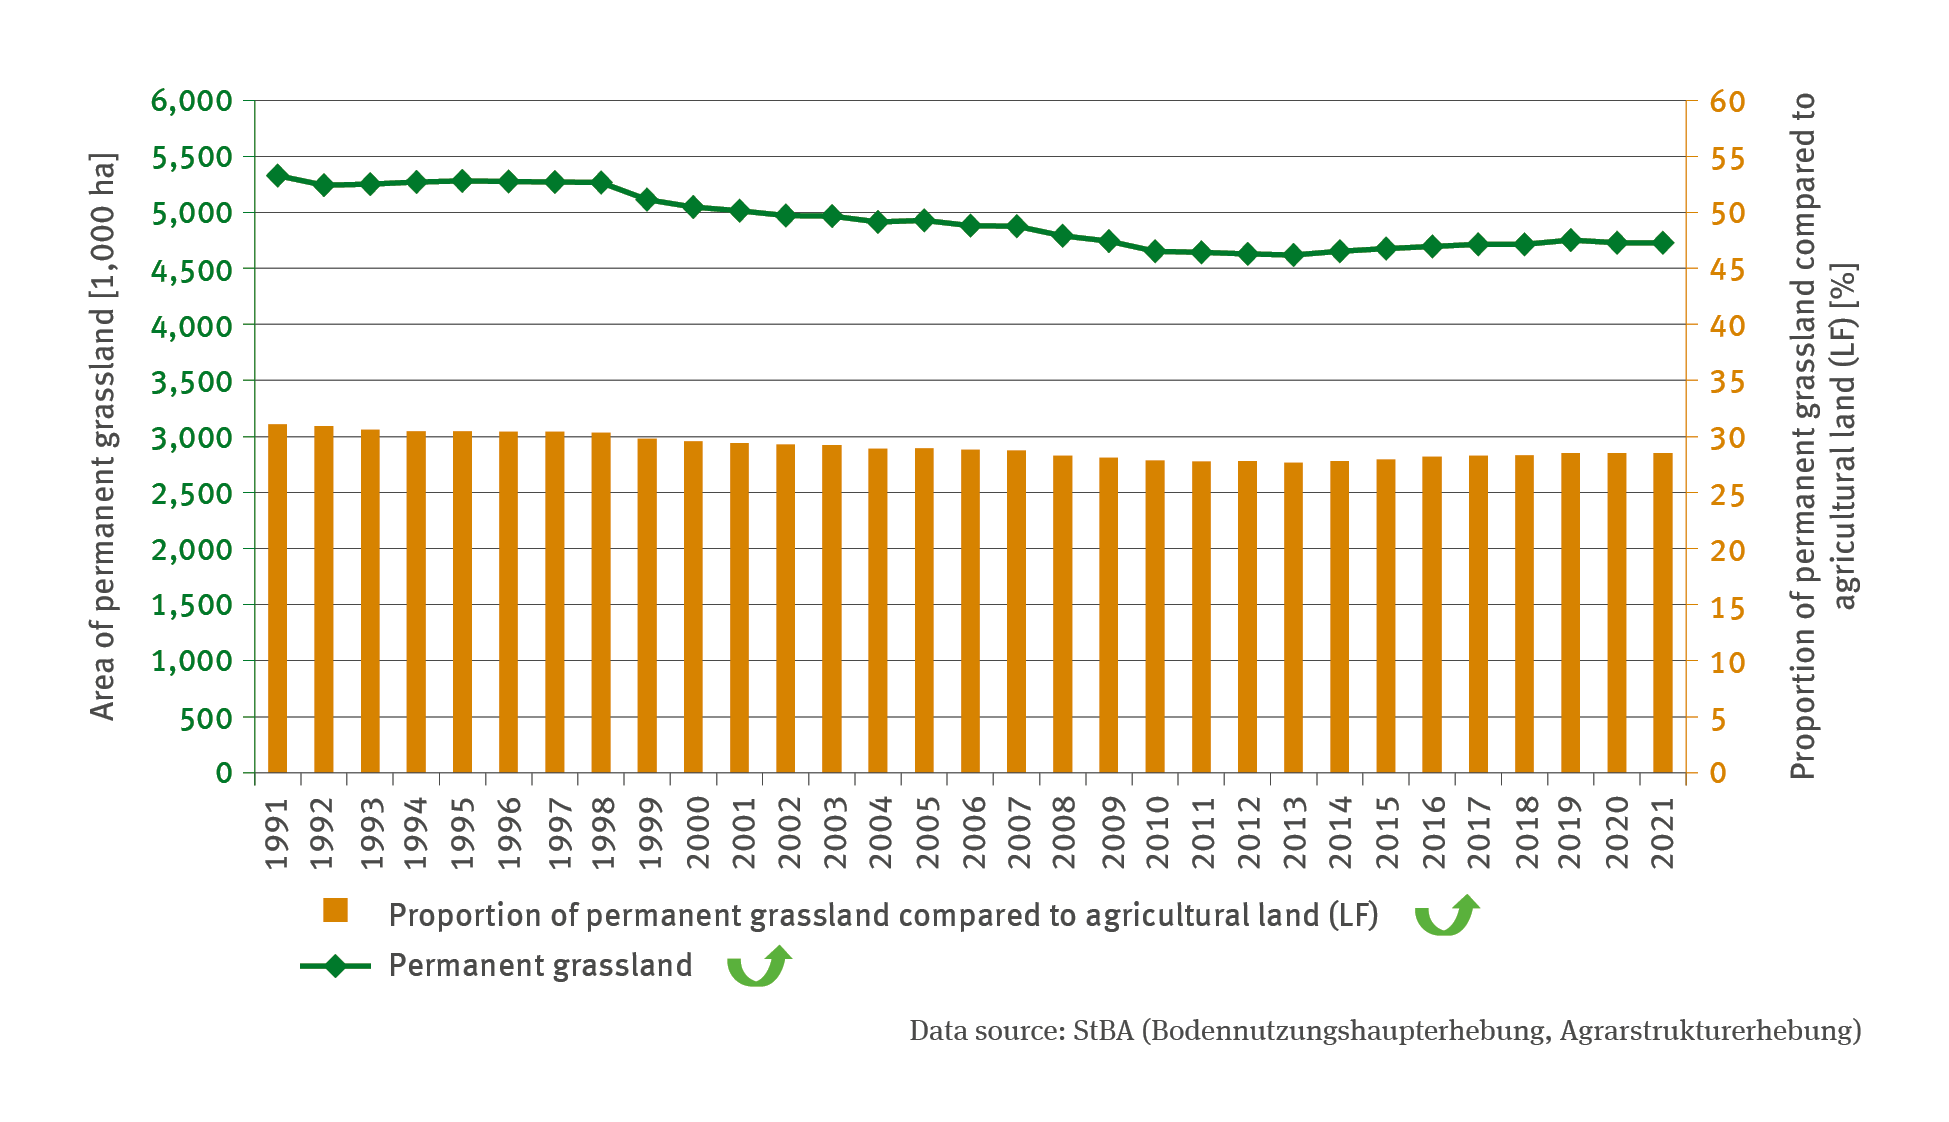
BO-R-2: Permanent grassland terrain

  • Klima
  • Fläche, Boden, Land-Ökosysteme
  • Land- und Forstwirtschaft
  • Diagramme
Export data
PNG
The illustration contains an XY scatter diagram which indicates the content of organic carbon and the content of total nitrogen in soil depths of up to 10 centimetres in milligrammes per gramme.

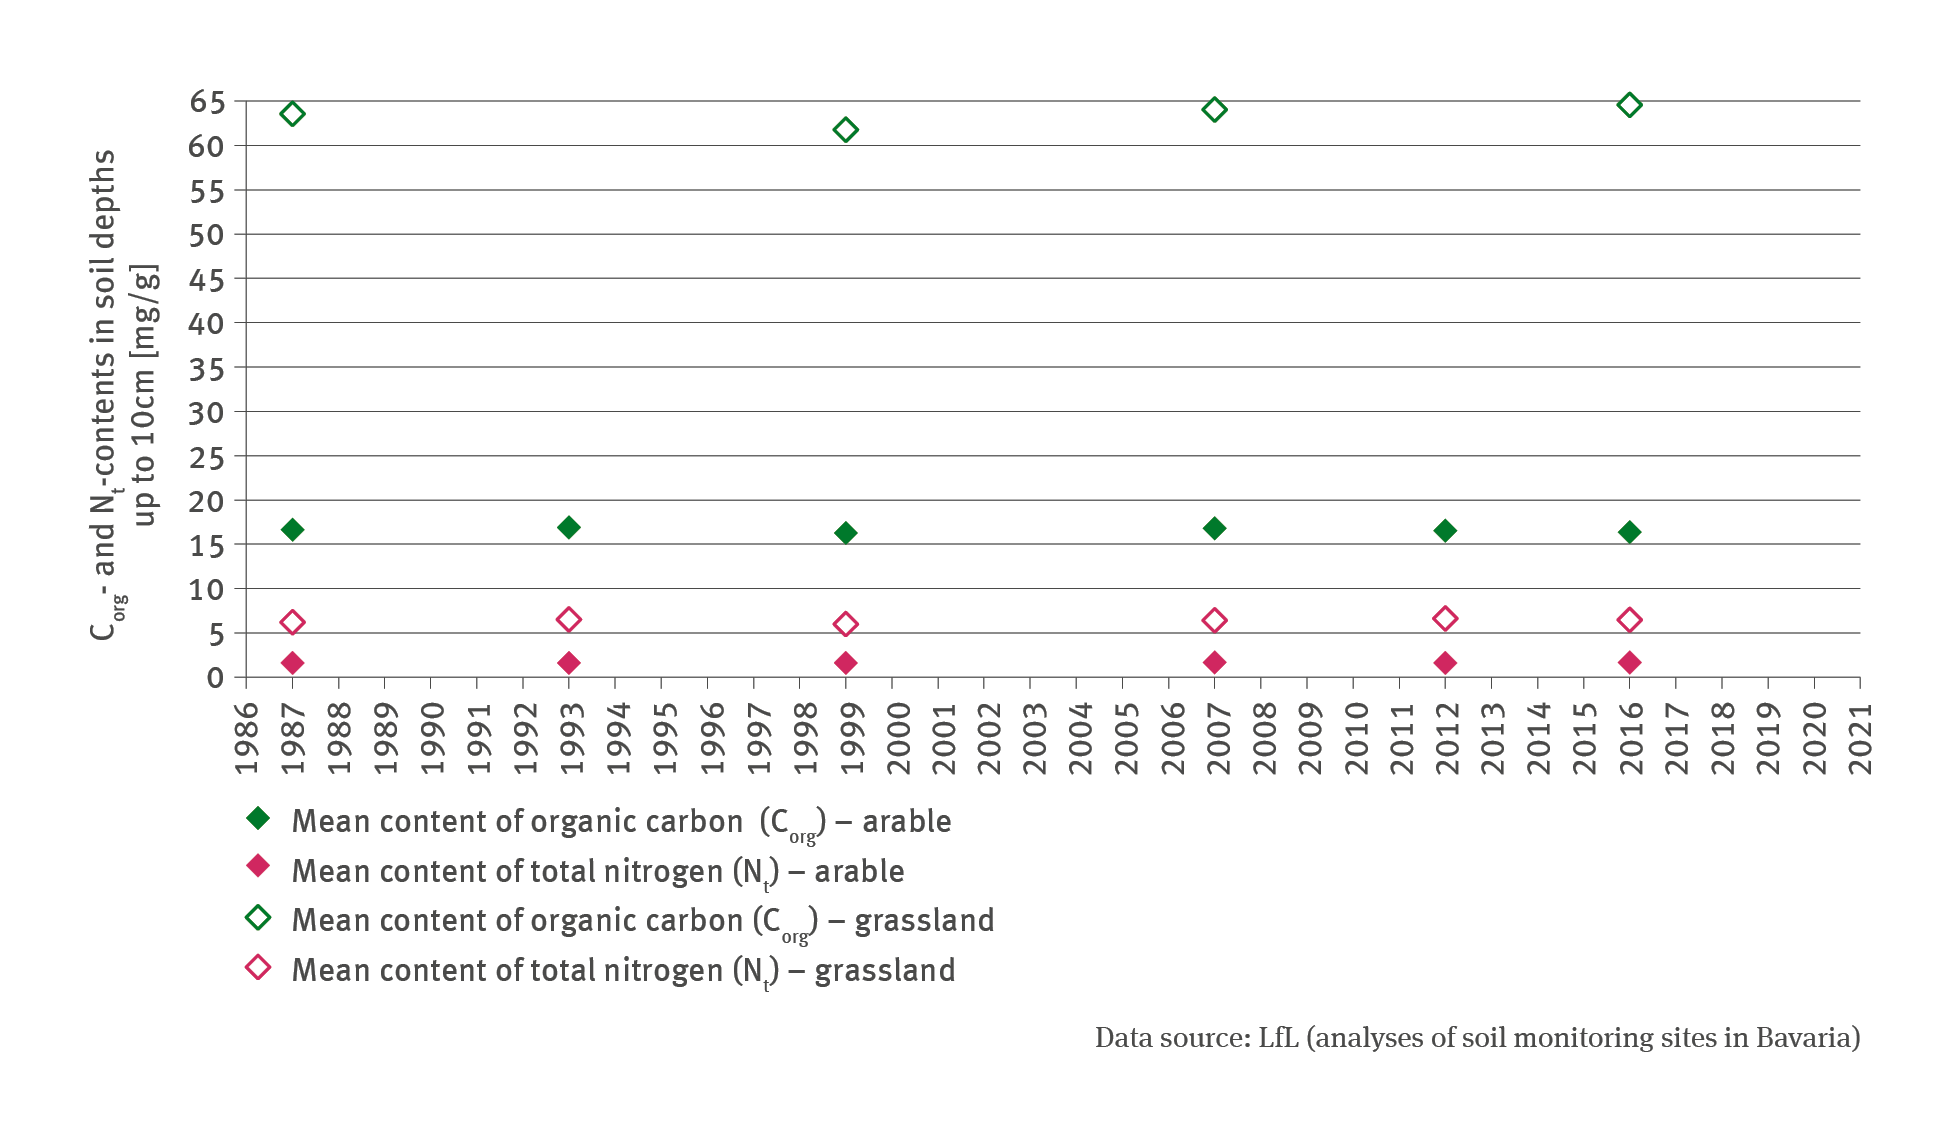
BO-R-1: Humus contents in soils of arable land and grassland soils – case study

  • Klima
  • Fläche, Boden, Land-Ökosysteme
  • Diagramme
Export data
PNG
The illustration contains a line chart which indicates the development of soil water reserves in agriculturally used soils as a percentage of usable field capacity. The time series extends from 1961 to 2021.

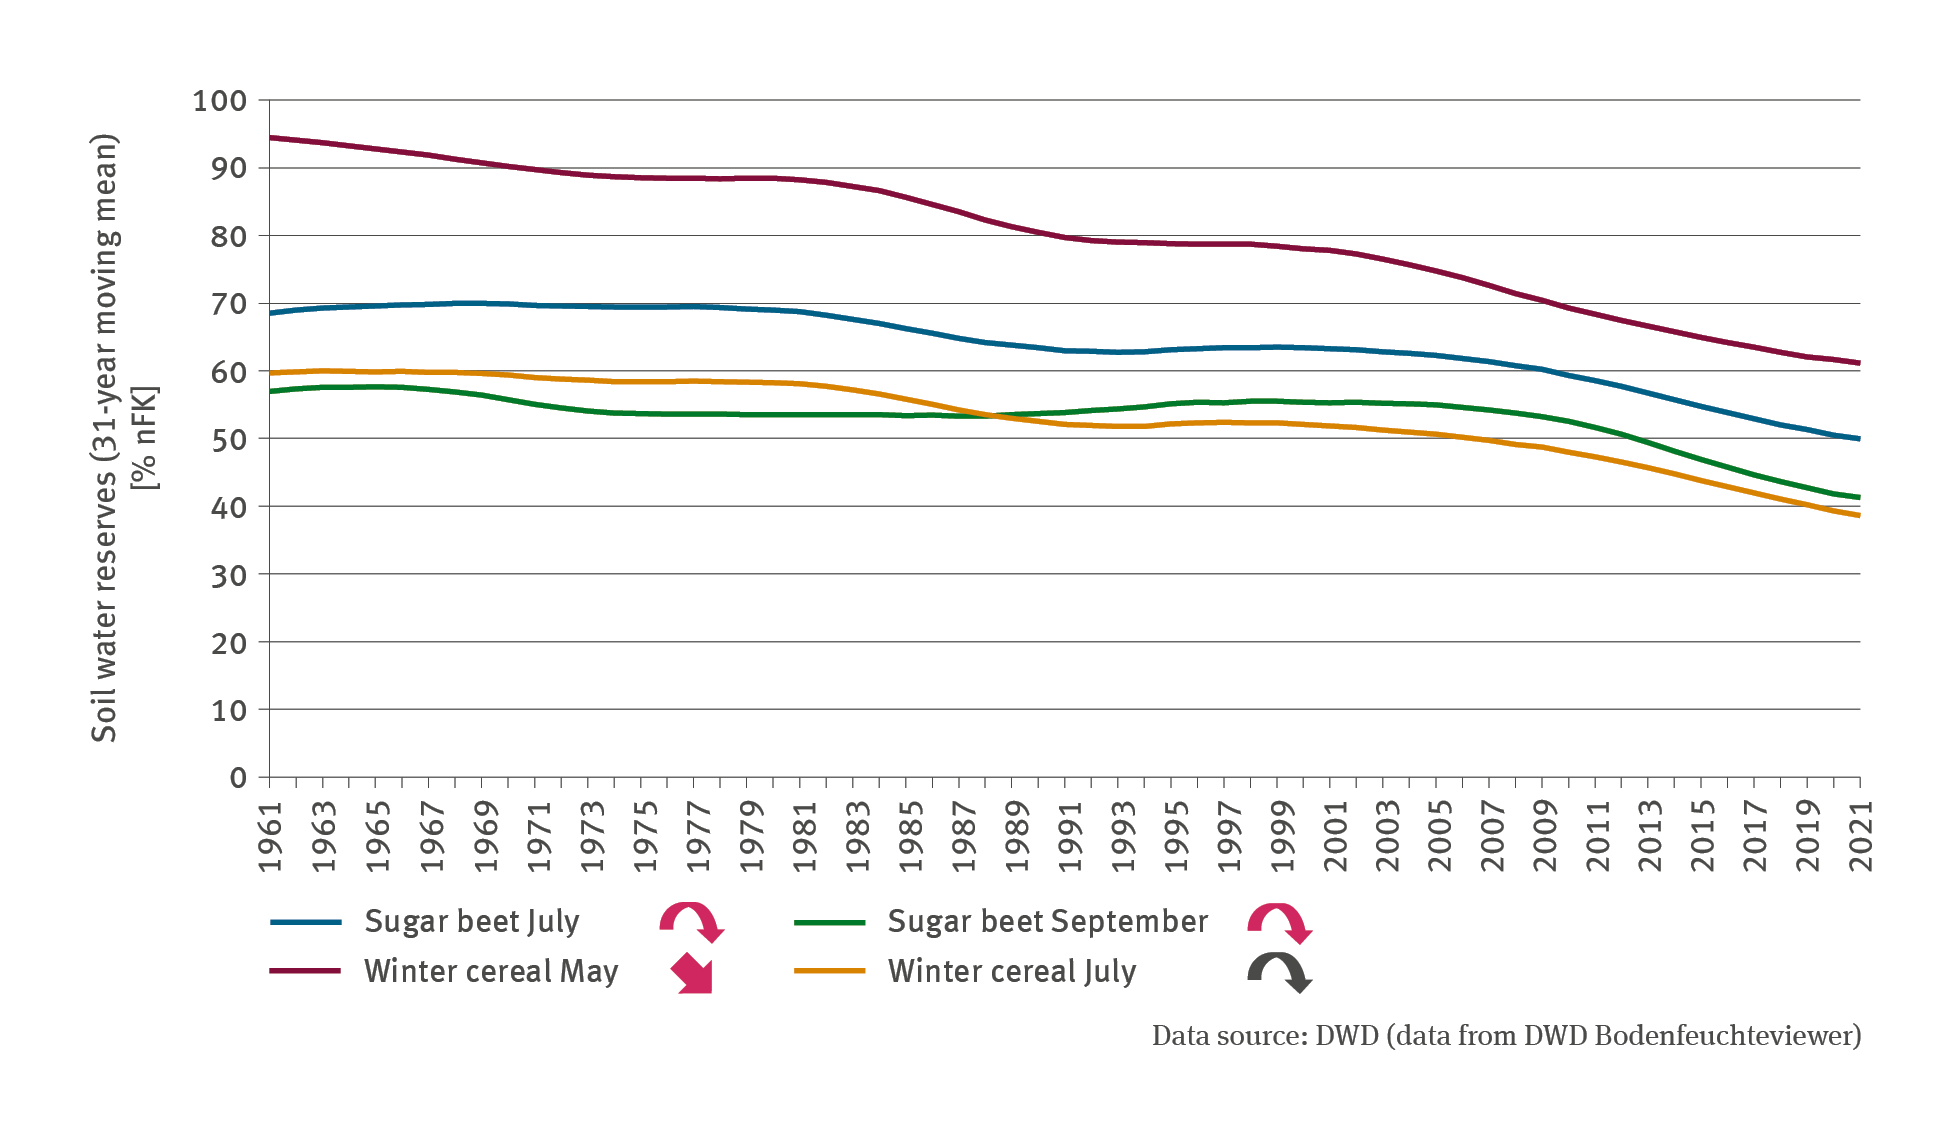
BO-I-1: Soil water in agriculturally used soils

  • Klima
  • Fläche, Boden, Land-Ökosysteme
  • Wasser
  • Land- und Forstwirtschaft
  • Diagramme
Export data
PNG
A graph shows the agricultural nitrogen surpluses for individual years and as rolling 5-year means between 1990 and 2022. The 5-year-mean nitrogen surpluses in kilogrammes per hectare dropped from 117 to 77. The target for 2028-32 is 70 kilogrammes per hectare and year.

Nitrogen surplus of the national farm-gate balance

  • Fläche, Boden, Land-Ökosysteme
  • Land- und Forstwirtschaft
  • Diagramme
  • Umwelt-Indikatoren
  • Daten und Tabellen
Export data
A graph shows the proportion of vulnerable ecosystems in Germany where the critical loads for eutrophication were exceeded between 2000 and 2019 and the target for 2030. In 2000, the share was 84 % and in 2019, it was 69 %.

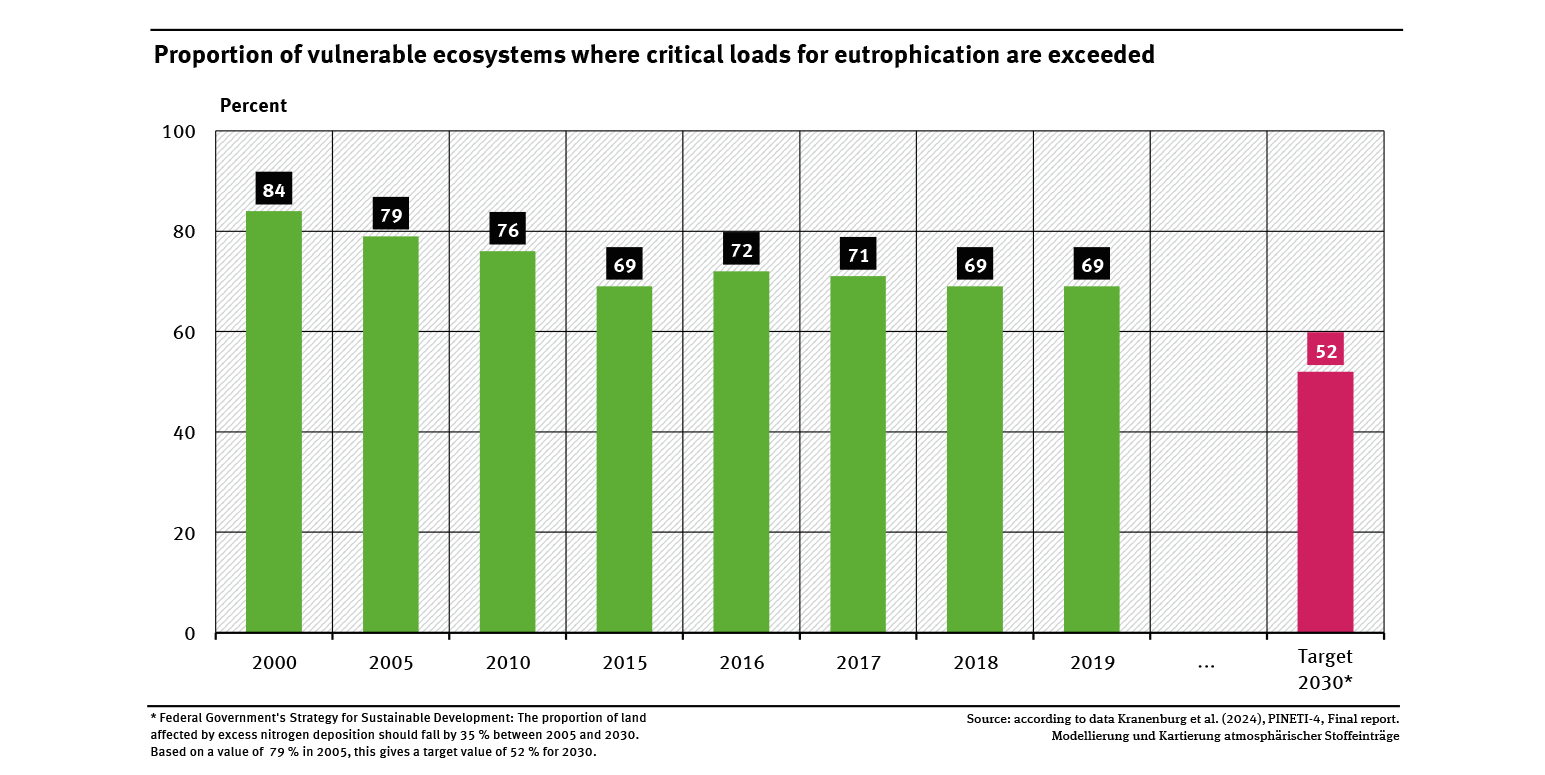
Proportion of vulnerable ecosystems where critical loads for eutrophication are exceeded

  • Fläche, Boden, Land-Ökosysteme
  • Diagramme
  • Umwelt-Indikatoren
  • Daten und Tabellen
Export data
Kinder pflanzen in Dessau ein Blumenbeet.

Children plant flowers in Dessau

  • Klima
  • Fläche, Boden, Land-Ökosysteme
  • Wasser
Export data
JPG

You can also search in other data portals of the German Environment Agency

Short link: www.umweltbundesamt.de/n300701en