Data Search

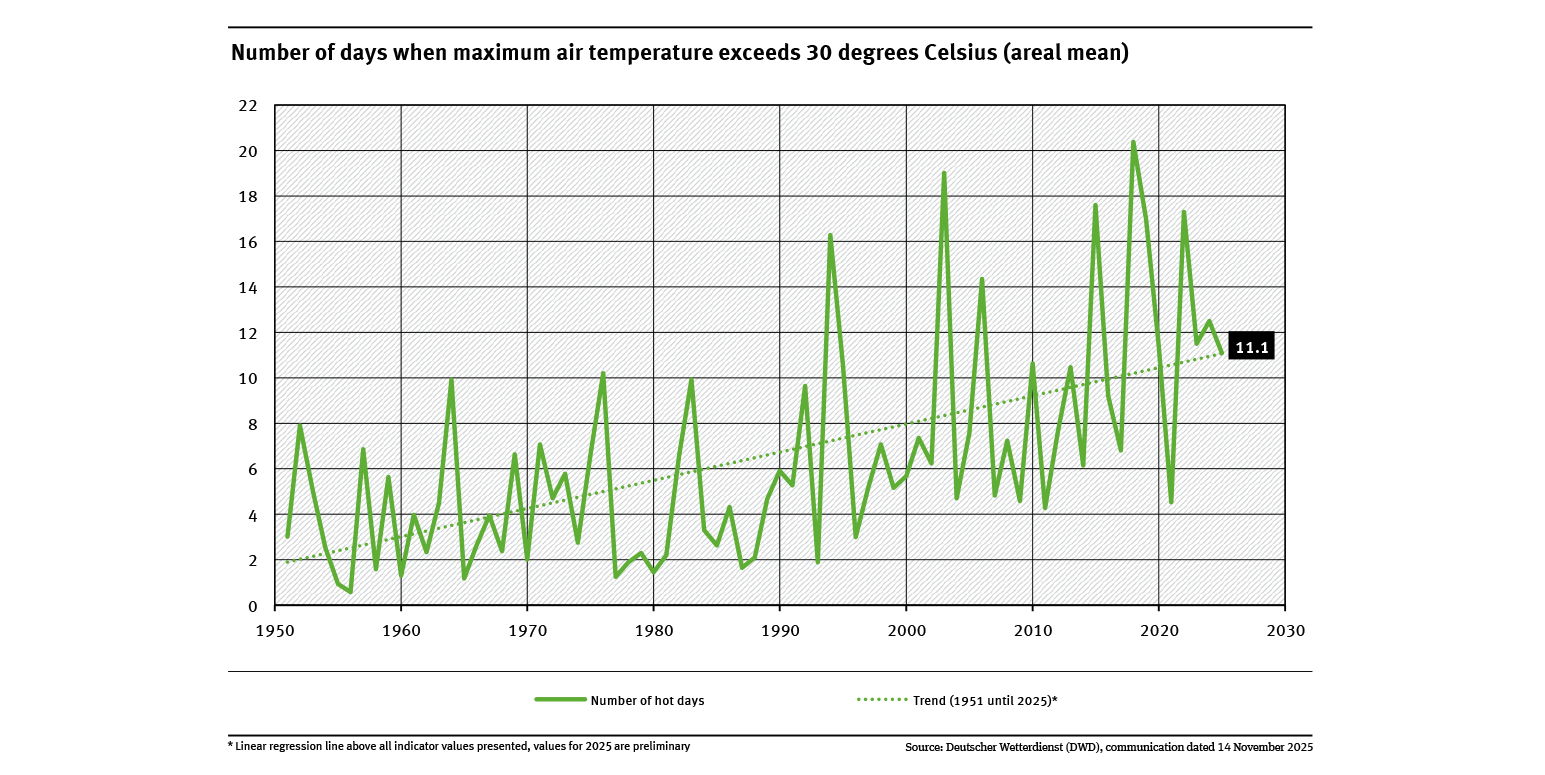
Number of days when maximum air temperature exceeds 30 degrees Celsius (areal mean)
- Klima
- Diagramme
- Umwelt-Indikatoren
- Daten und Tabellen

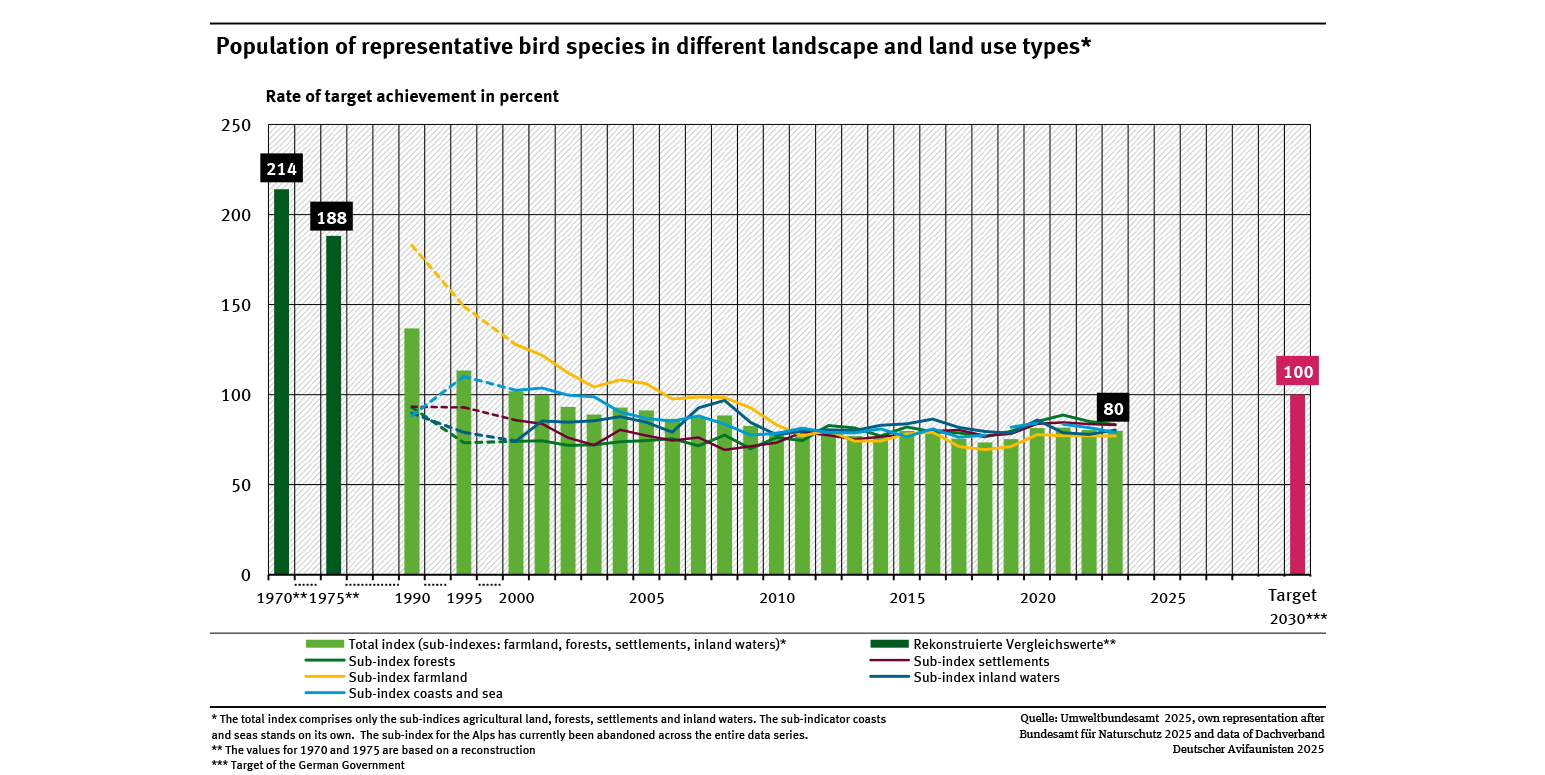
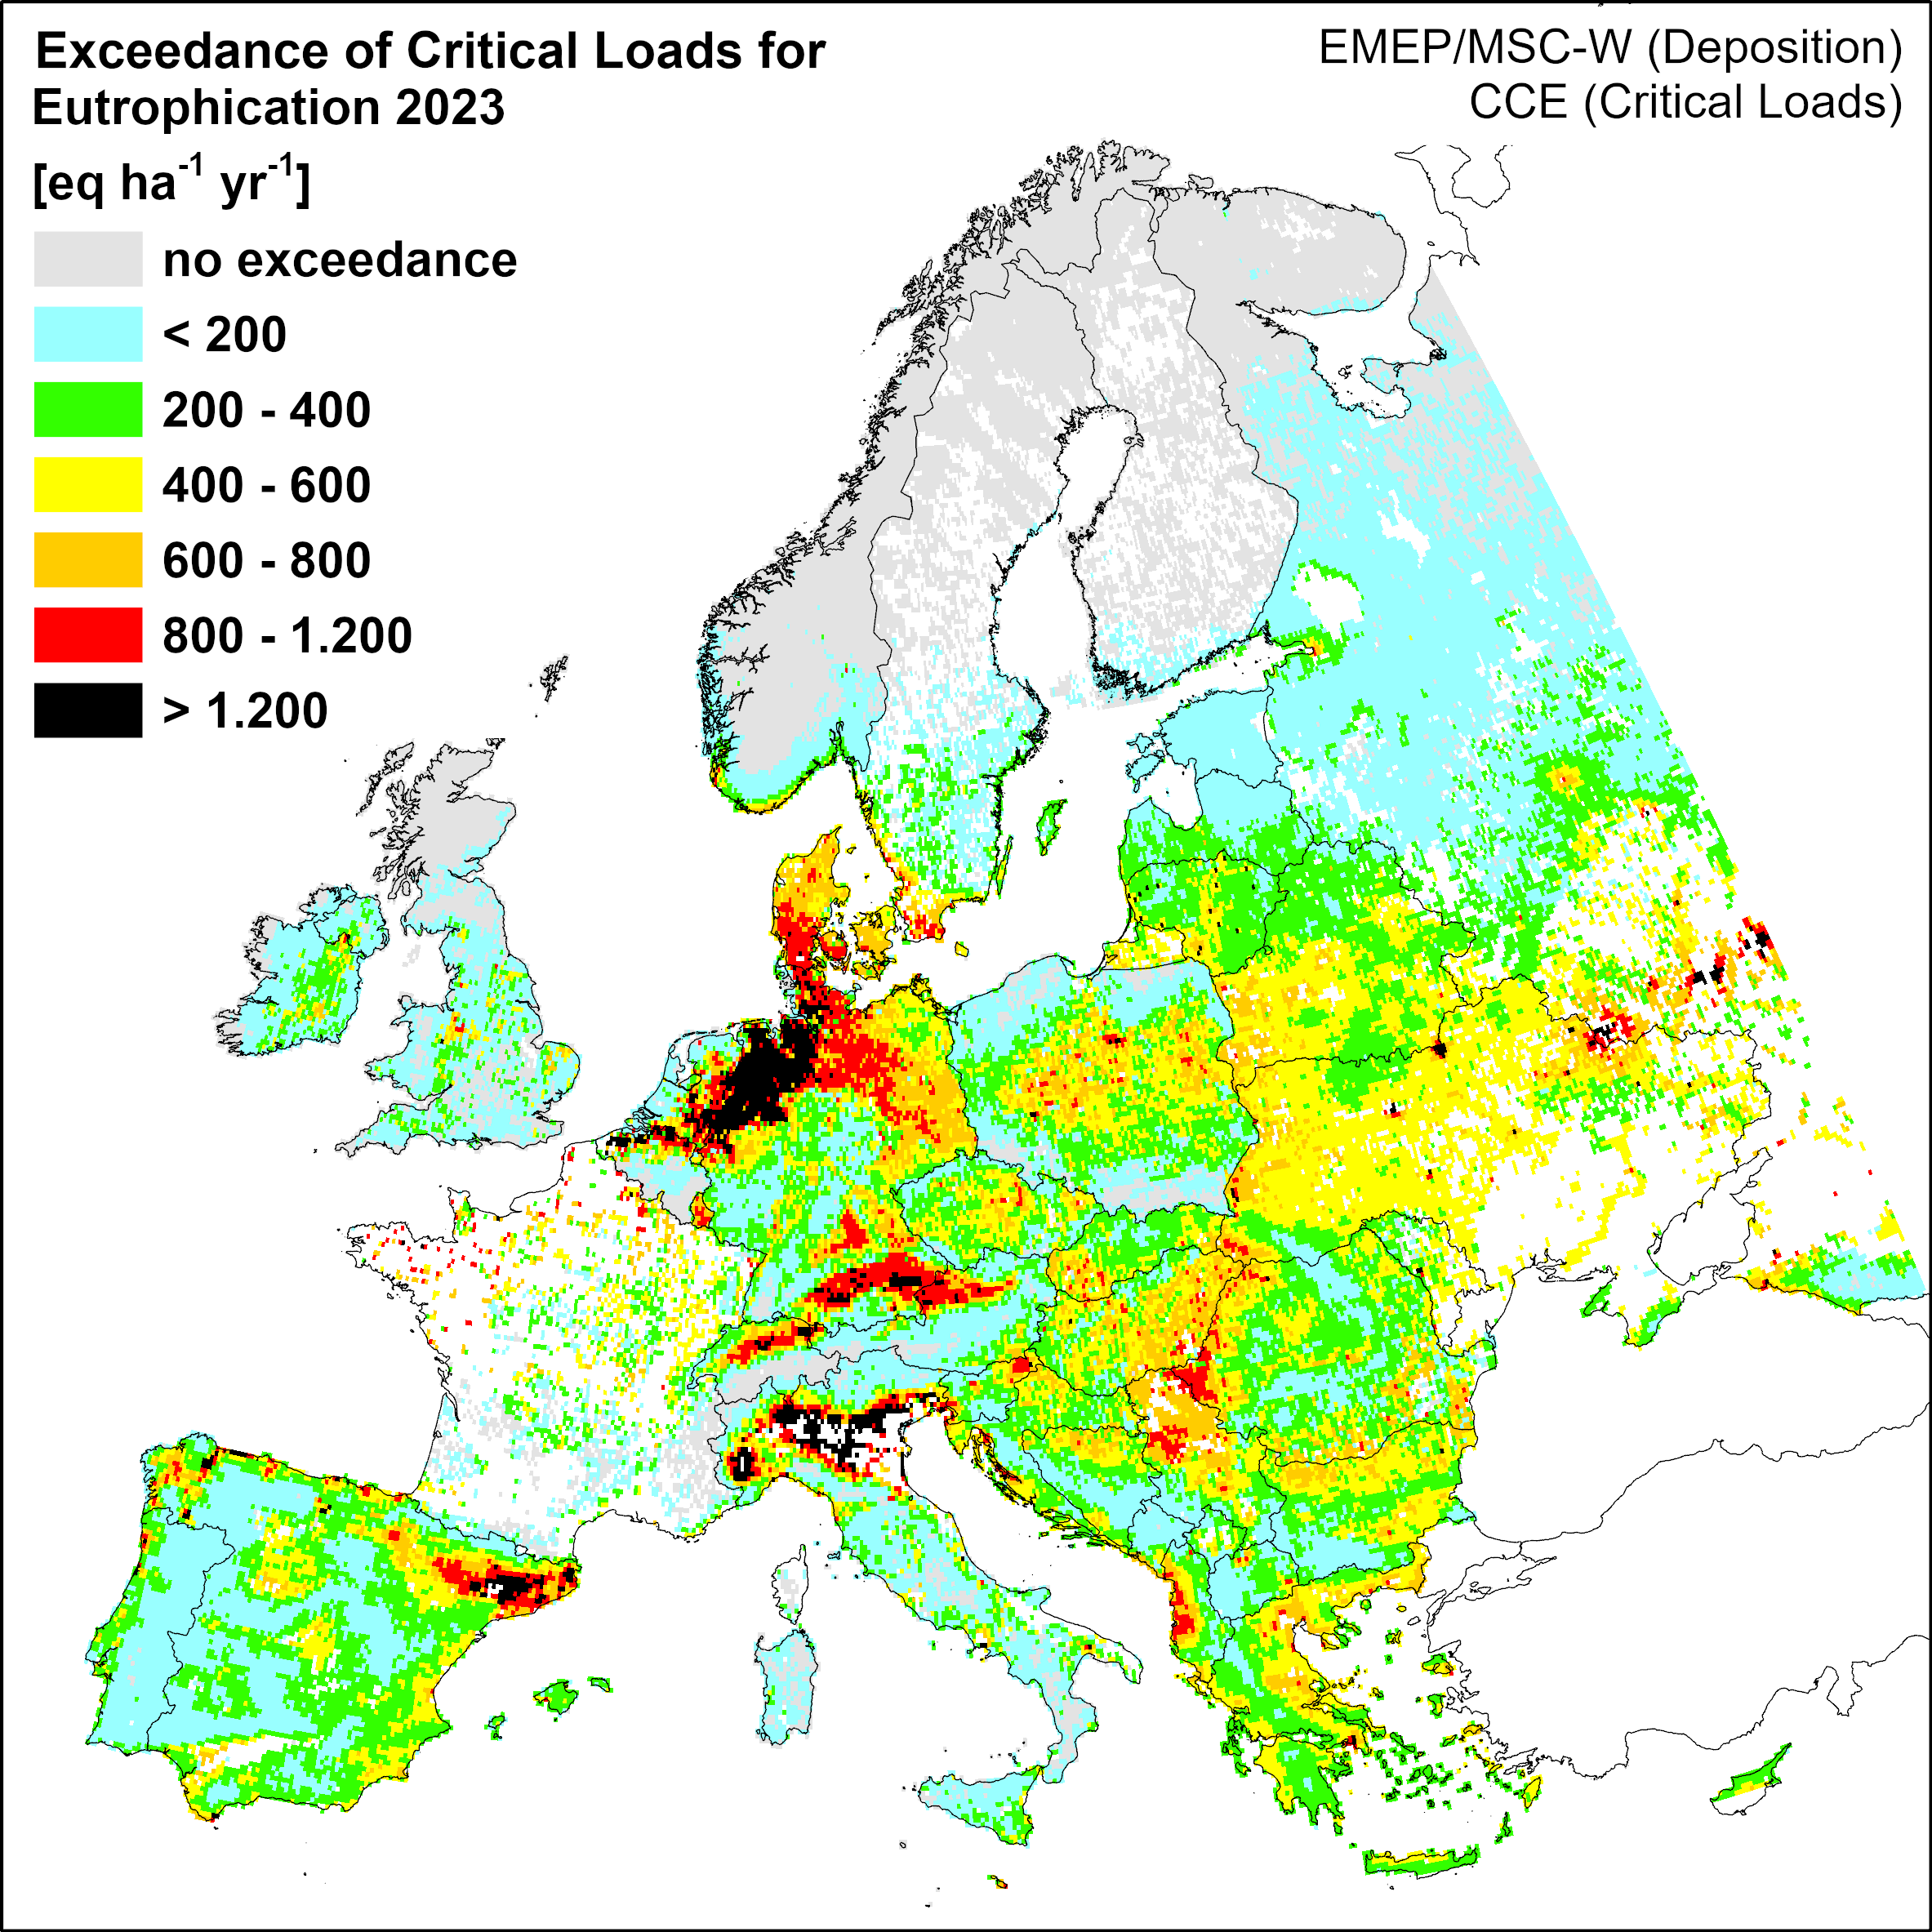
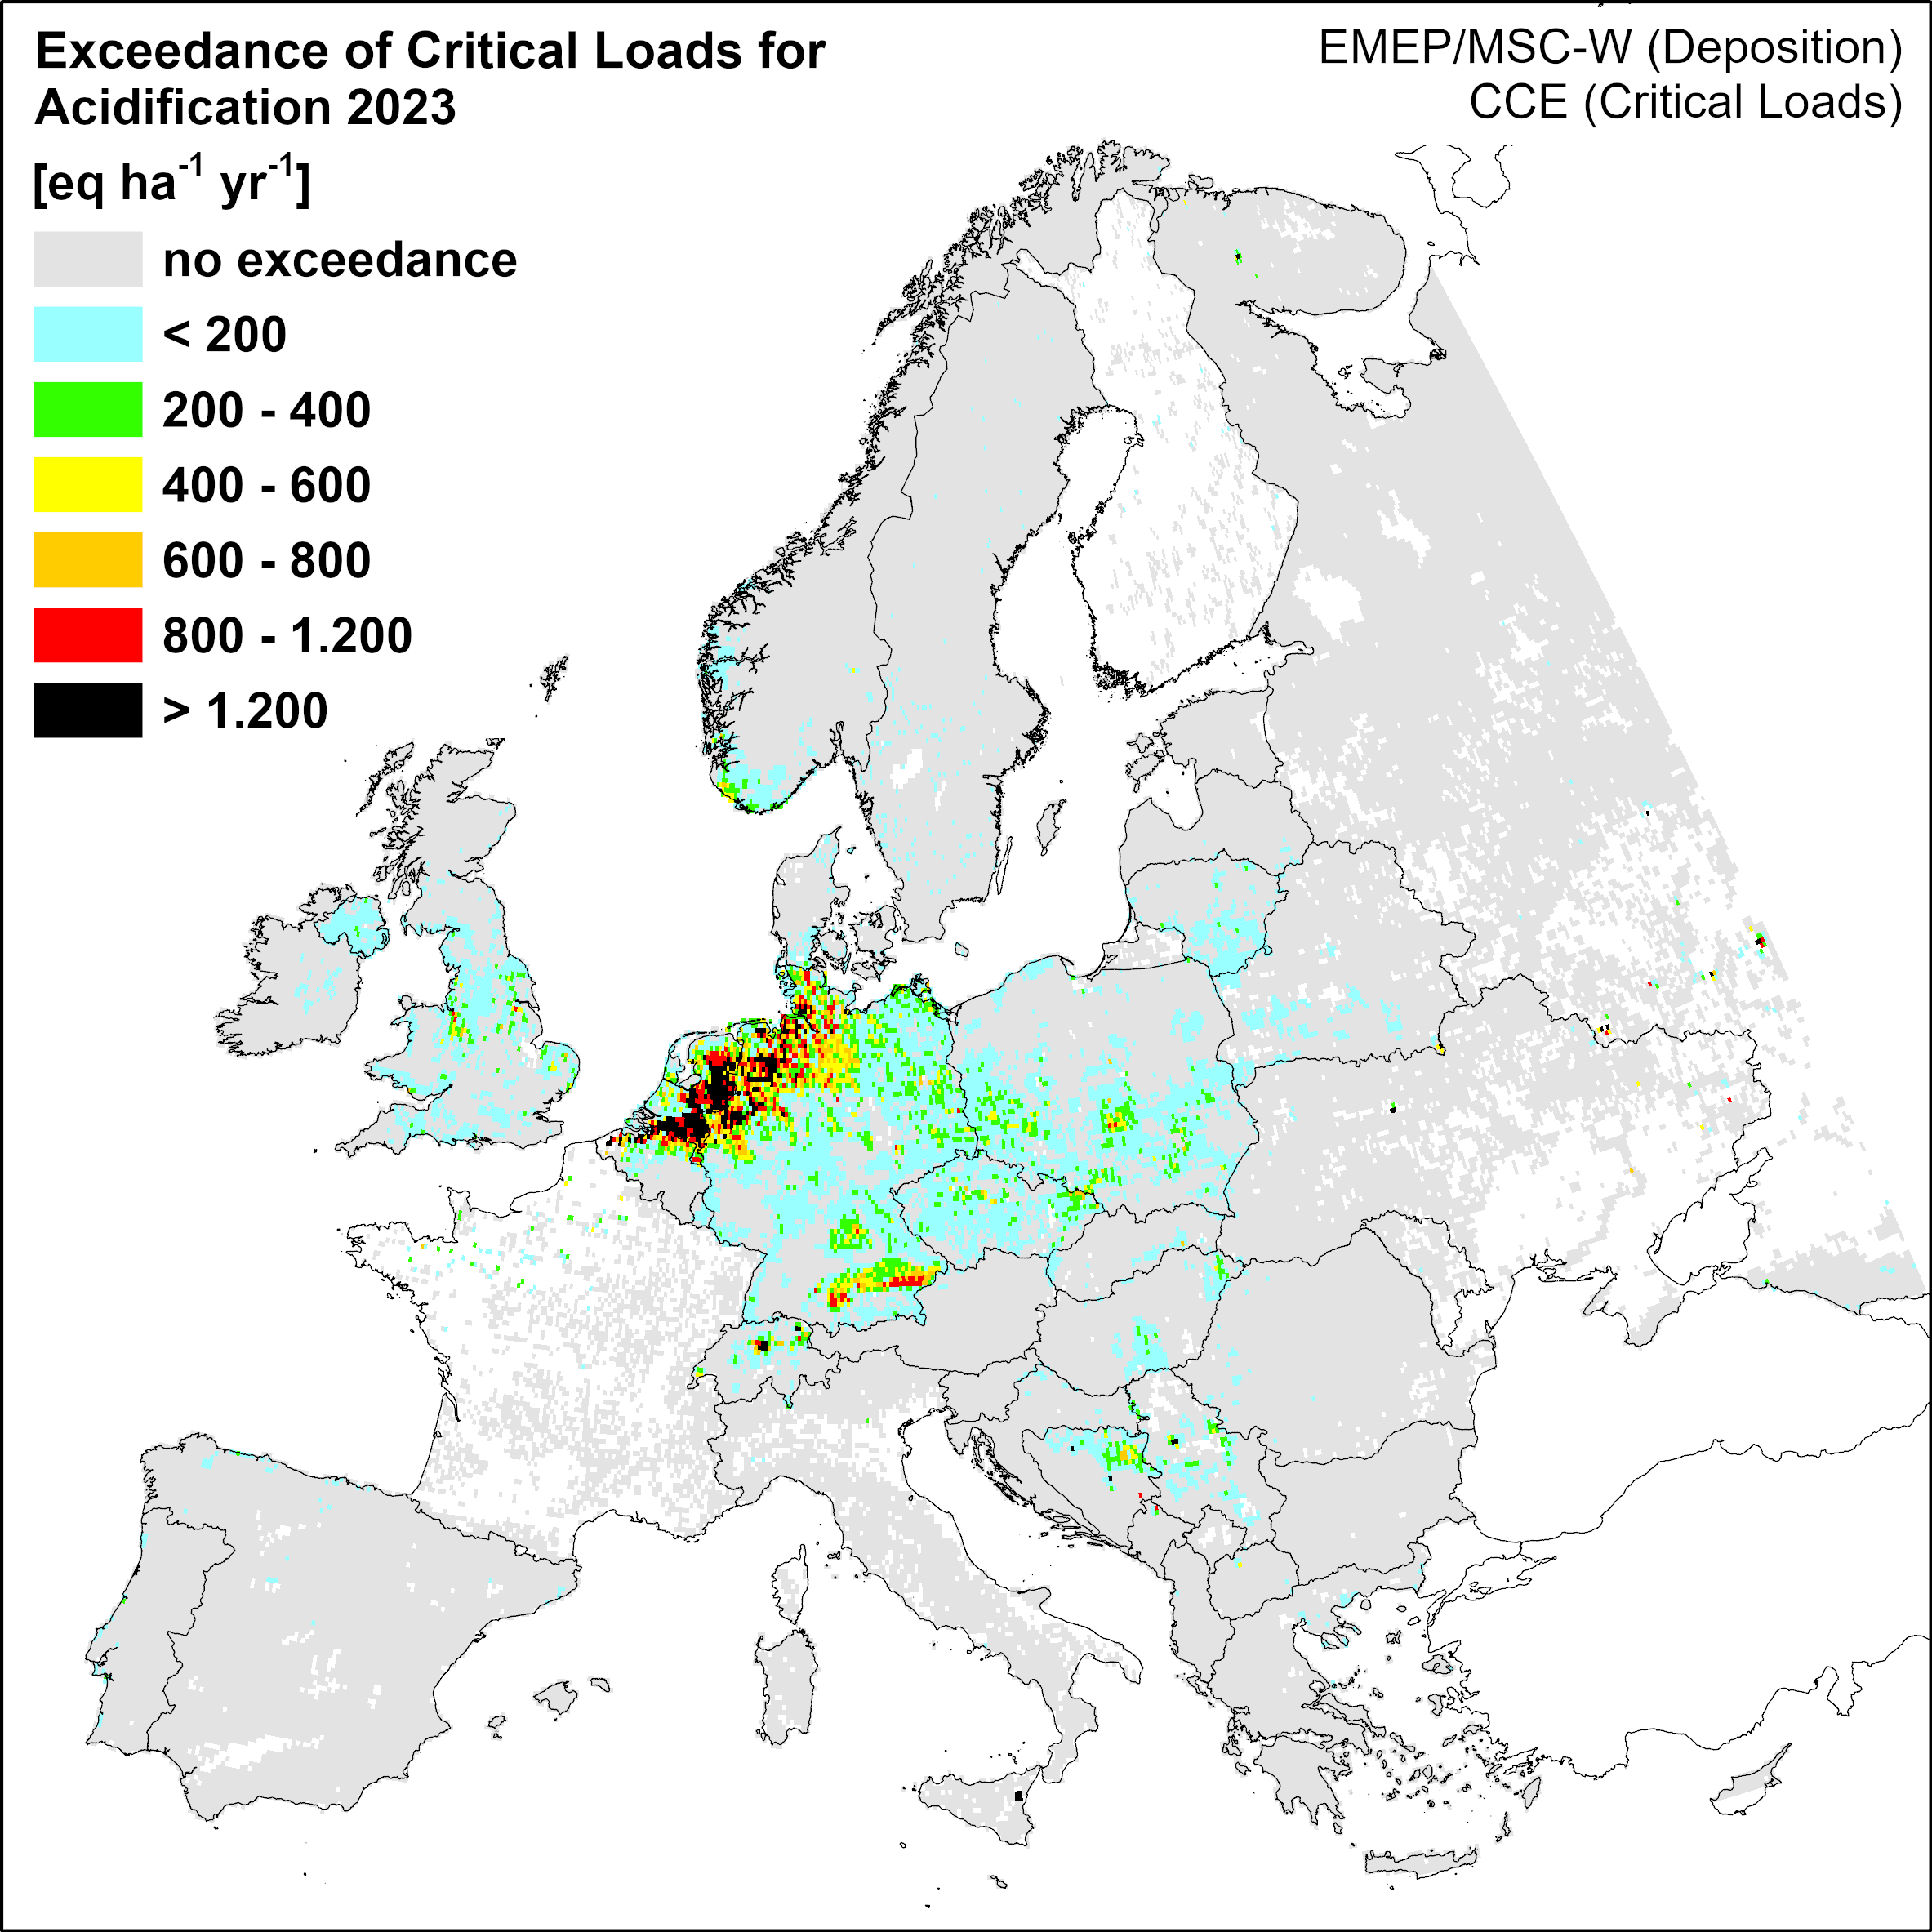
Population of representative bird species in different landscape and land use types
- Fläche, Boden, Land-Ökosysteme
- Diagramme
- Umwelt-Indikatoren
- Daten und Tabellen

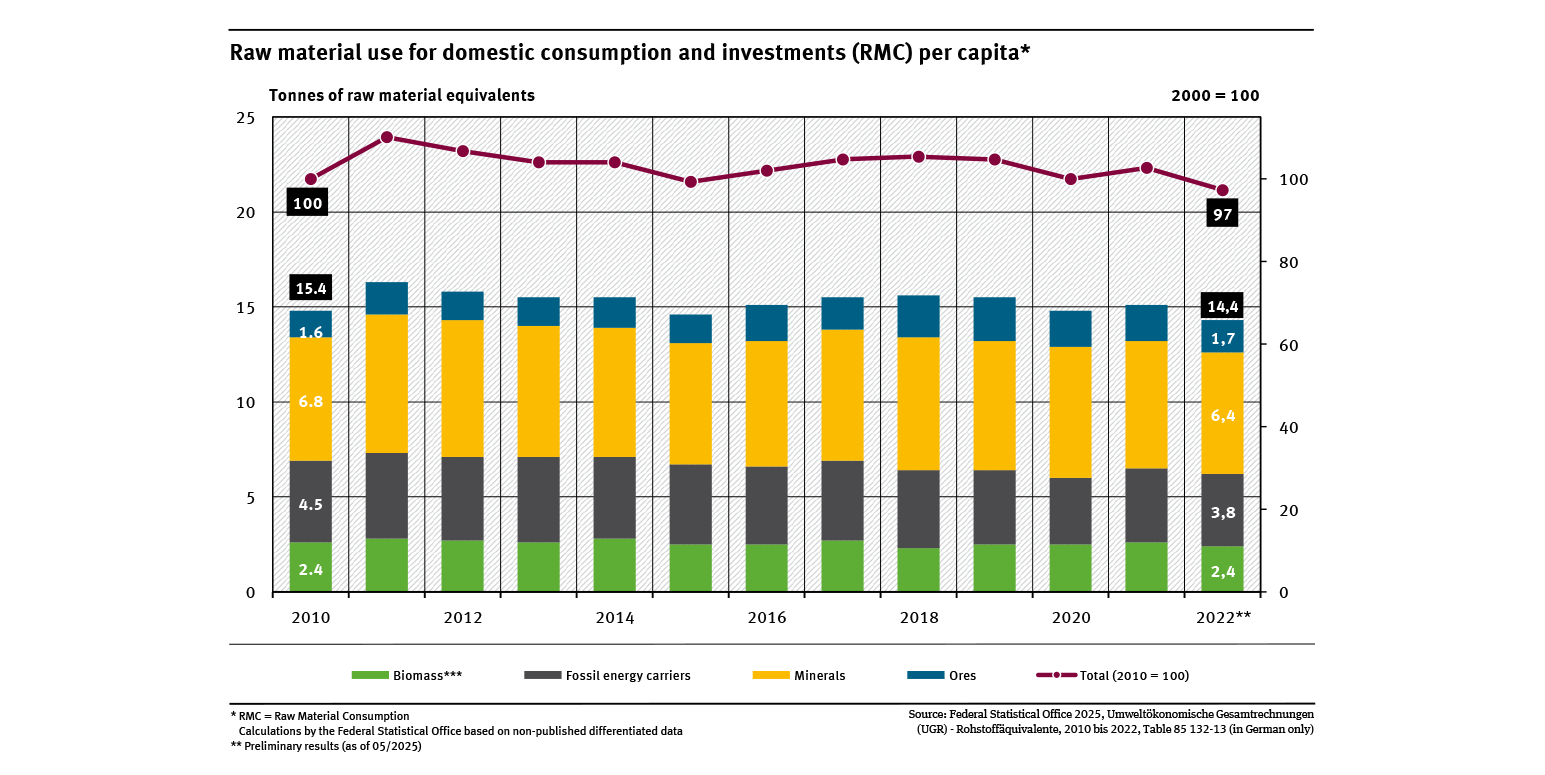
Raw material use for domestic consumption and investments (RMC) per capita
- Ressourcen und Abfall
- Diagramme
- Umwelt-Indikatoren
- Daten und Tabellen

Time series for the development of renewable energy sources based on statistical data from the Working Group on Renewable Energy-Statistics (AGEE-Stat) in Germany (XLSX-file)
- Klima
- Energie
- Diagramme
- Infografiken
- Daten und Tabellen
Export data
Time series for the development of renewable energy sources based on statistical data from the Working Group on Renewable Energy-Statistics (AGEE-Stat) in Germany (PDF-file)
- Diagramme
- Infografiken
- Daten und Tabellen
Export data

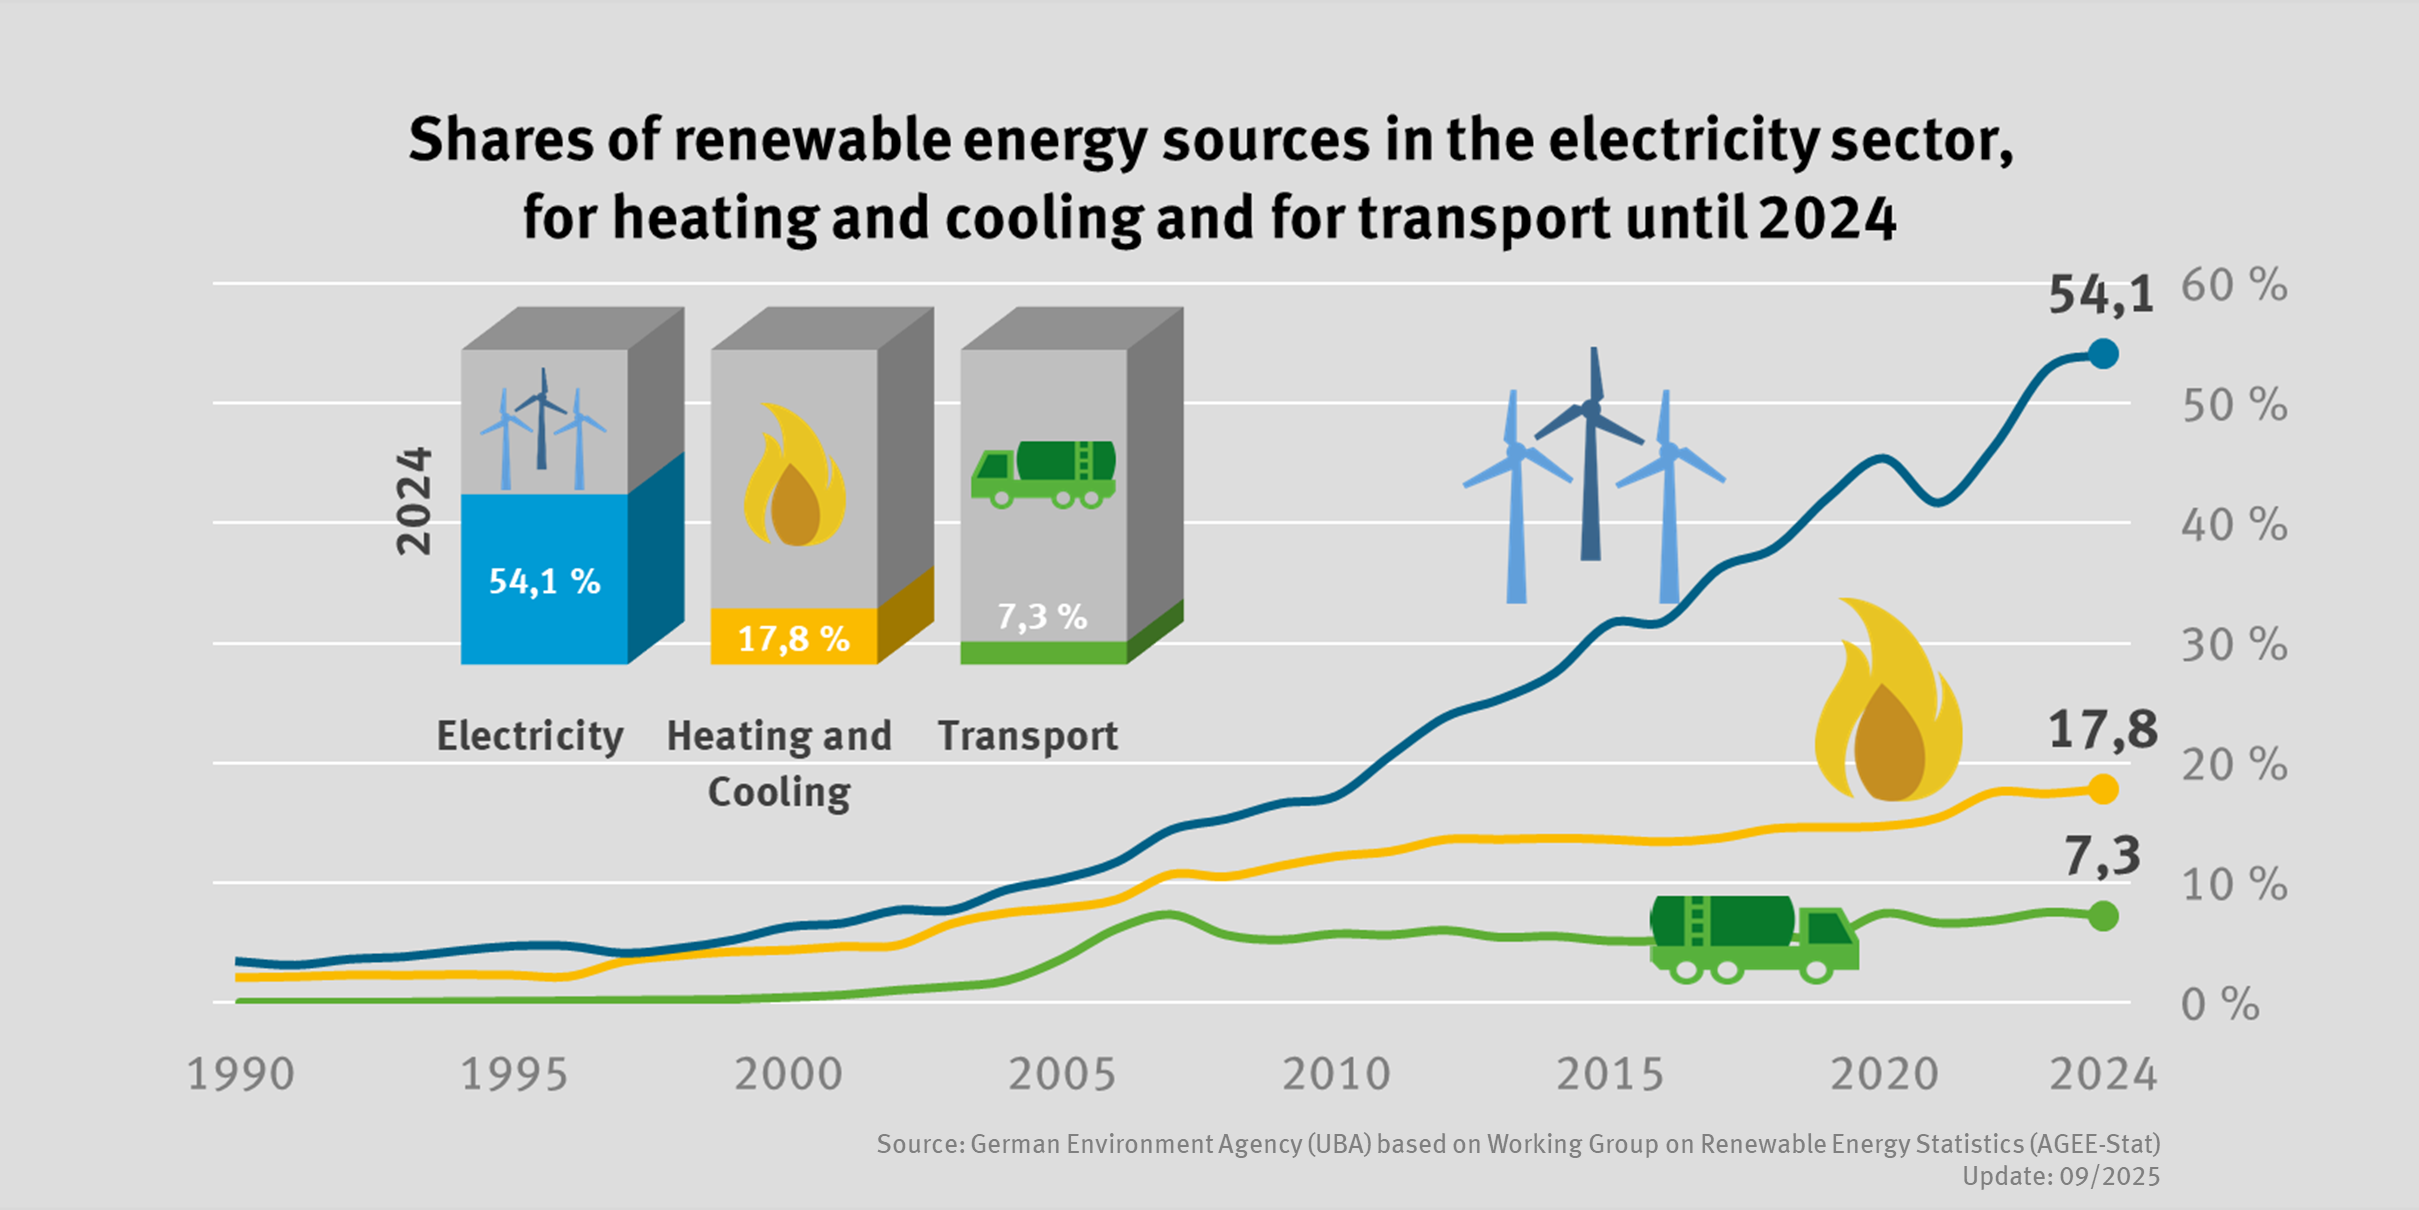
Development of renewable energy shares for electricity, heat and transport
- Energie
- Infografiken
Export data


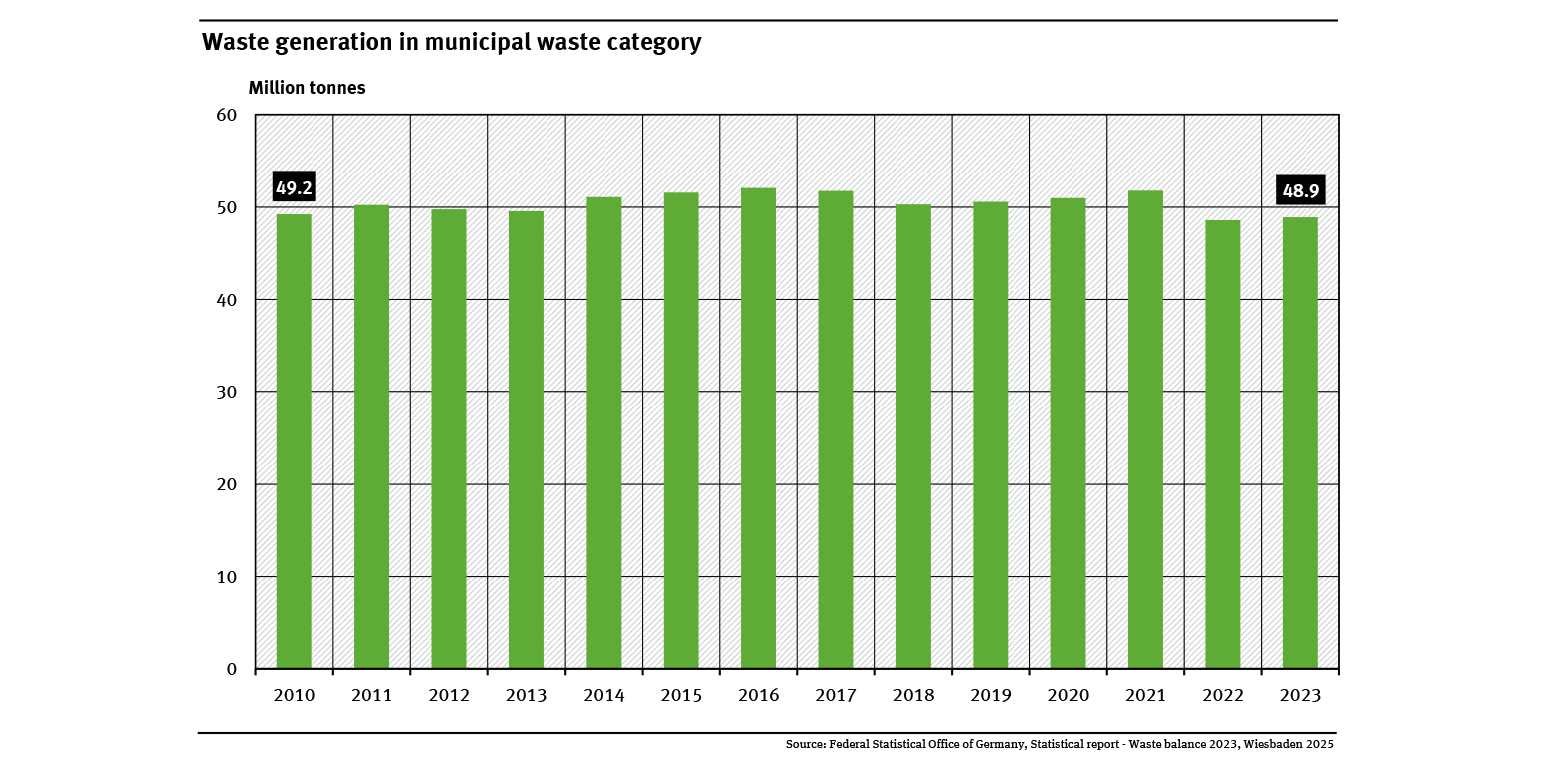
Waste generation in municipal waste category
- Ressourcen und Abfall
- Diagramme
- Umwelt-Indikatoren
- Daten und Tabellen

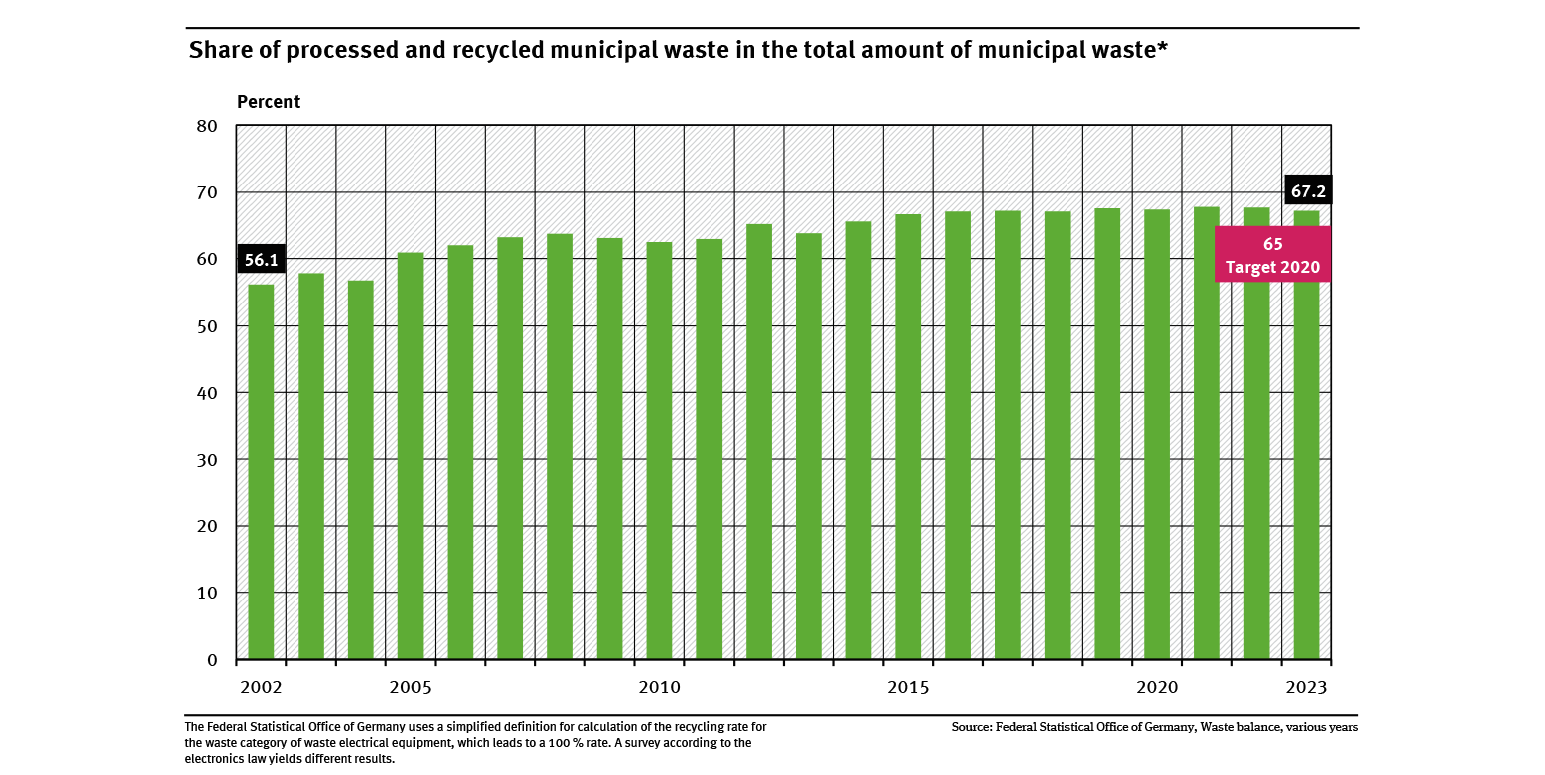
Share of processed and recycled municipal waste in the total amount of municipal waste
- Ressourcen und Abfall
- Diagramme
- Umwelt-Indikatoren
- Daten und Tabellen