energy consumption

Umwelt-Indikator

Indicator: Environmental costs of energy and road transport

A graph shows the development of environmental costs energy generation and road transport between 2017 and 2022. They were 300.3 billion euros in 2017 and 301.1 billion in 2022.

Power generation, heat generation and transport activities pollute the environment, among other things, through the emission of greenhouse gases and air pollutants.This results in high subsequent costs for society, for example through environmentally-induced diseases, damage to ecosystems or even buildings.For Germany, these environmental costs are estimated to amount to almost 301 billion euros i... read more

Indicator: Final energy consumption of transport

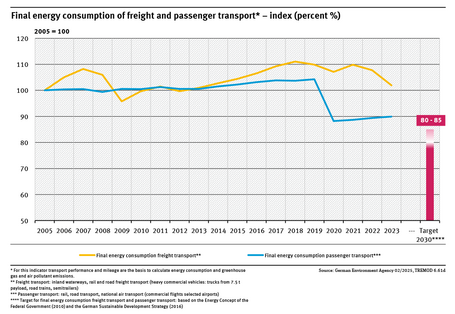
A graph shows the final energy consumption in freight and passenger transport between 2005 and 2022 and the targets of the Federal Government (2005 = 100) presented as an index.

The Federal Government wants to lower final energy consumption of freight and passenger transport by 15 to 20 % by 2030 compared to 2005.Freight and passenger transport have become significantly more efficient since the early 1990s, but the increased transport performance has led to an increase or stagnation in final energy consumption.Final energy consumption in freight transport remains at a hig... read more

Indicator: Energy consumption for buildings

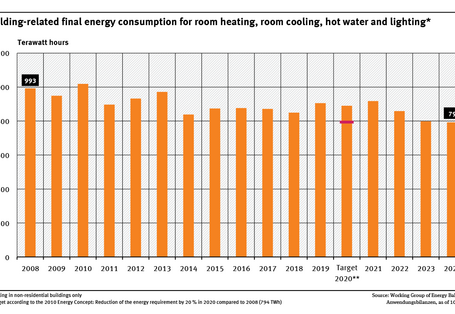
A graph shows the building-related final energy consumption for room heating, room cooling, hot water and lighting for 2008 to 2022. The indicator decreases with fluctuation. No differentiation is shown between the individual uses.

Final energy consumption associated with buildings decreased by 15.2 % between 2008 and 2022.However, according to the 2010 Energy Concept, the heat demand of buildings should have decreased by 20 % between 2008 and 2020. In fact, consumption fell by only 10.9 %.Due to the Russian war of aggression against Ukraine and the subsequent efforts to save energy in Germany, final energy consumption in bu... read more

Indicator: Global environmental footprint of consumption

A graph shows the global environmental footprint of household consumption, represented by the indicator’s energy consumption, CO₂ emissions and raw material use. The indicators show the environmental footprint generated by the consumption activities of private households in Germany and abroad

Compared with 2010, energy consumption by private households and associated carbon dioxide emissions decreased slightly overall.Raw material use stagnated at the level of 2010.In its Sustainability Strategy the German government sets the goal of reducing the global environmental footprint of private household consumption in all three areas. read more

Climate | Energy

Renewable energies in figures

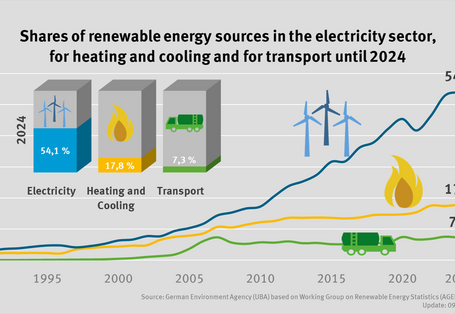
The diagram shows how the shares of renewable energies for electricity, heat and transport are developing. While electricity steadily until 2020, the development of heat and transport shares stagnated for several years. The share of renewables in electricity fell significantly in 2021 (to 41.5 percent), but rose since then considerably to 52.5 percent in 2023. The share of renewables in the heat sector reaches 17.7 percent in 2023 and in the transport sector 7.5 percent.

Up-to-date and quality controlled data on the development of renewable energies in Germany are an important basis for the evaluation of Germany’s energy transition. The Working Group on Renewable Energy Statistics (AGEE-Stat) provides these data for international reporting obligations as well the interested public. read more

The Umweltbundesamt

For our environment