Final 2021 greenhouse gas emissions balance: Emissions declined by 39 percent over 1990, complying with EU climate action targets
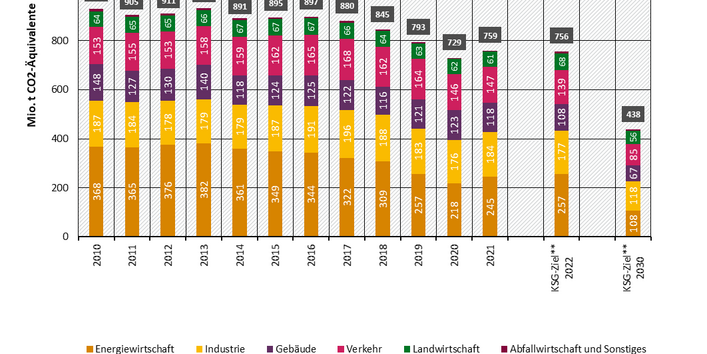
Germany is in full compliance with European emission reduction targets. Final data on greenhouse gas emissions for 2021 show that Germany had emissions of 759.1 million tonnes of CO₂ equivalents in 2021, which is about 29.6 million tonnes (4%) more than in 2020 and 39% less compared to 1990. Energy and industrial emissions in particular have increased while CO₂ emissions from households and agriculture have decreased. These are the results of the calculations which German Environment Agency (UBA) has submitted to the European Commission. Around 403 million tonnes of CO₂ equivalents in the non-emissions trading sector (mainly transport and buildings) means Germany managed to stay on budget in 2021 in the first year of targets under the Effort Sharing Regulation (ESR).
The energy industry recorded an increase of 27 million tonnes (12.5%) of CO2 equivalents in 2021. There was a marked increase in emissions from lignite and hard coal electricity generation due to greater use of coal. In contrast, the use of lower-emissions natural gas declined significantly in the second half-year because of higher prices. Main reasons for the increased use of fossil fuels to produce electricity: much less electricity was produced from renewable energy sources (17.5 TWh less than the previous year), in particular from wind energy, and the 14.9 TWh increase in gross electricity consumption.
Industrial emissions increased in the industrial sector in 2021 by 4.3% (7.6 million tonnes of CO₂ equivalents). This was due mainly to economic recovery after the coronavirus crisis and an increase in the use of fossil fuels. The most significant percentage increase was in the steel industry, where crude steel output rose by about 12%.
Transport sector emissions in 2021 rose by one percent over 2020 levels to 147 million tonnes of CO₂ equivalents. The rise is due mainly to road traffic where vehicle mileage and total sales of fuel remained virtually unchanged from the previous year, but less biofuel used caused an uptick in emissions. Vehicle mileage – with the exception of freight transport – has decreased significantly compared to pre-pandemic levels (2019).
In contrast, buildings sector emissions decreased by 5.2 million tonnes of CO₂ equivalents (4.2%). The reduction in emissions is mainly due to the special factor of significantly reduced heating oil purchases. Heating oil inventories were already stocked up extensively in 2019 and 2020 in response to favourable prices and in anticipation of the Fuel Emission Allowance Trading Act. In contrast, natural gas consumption increased for weather-related reasons.
Emissions in the agriculture sector declined slightly by about 1.1 million tonnes to 61.3 million tonnes of CO₂ equivalents, thus continuing the trend of shrinking numbers of animals of previous years. Cattle numbers sank by 2.3%, pig numbers by 9.2%. As a result, there was less manure with corresponding lower emissions (-4% compared to 2020). Improved methodology in emissions calculation is the major factor accounting for the undershooting of prescribed annual emission budgets.
Emissions by greenhouse gas
Carbon dioxide (CO₂) continued to dominate greenhouse gas emissions in 2021 (89.4%), due mainly to the combustion of fossil fuels. The remaining emissions are divided between methane (CH₄) (5.4%) and nitrous oxide (N₂O) (just under 3.7%), predominantly from the agricultural sector. Compared to 1990, Germany has cut emissions of carbon dioxide by 35.6%, methane by 65.5% and nitrous oxide by 52%.
Fluorinated greenhouse gases (F-gases) account for only about 1.5% of total greenhouse gas emissions, but some have very high global warming potential. F-gas emissions have fallen by 32 since 1995%.
Important note
The data presented here are calculated in the international greenhouse gas reporting system based on the GWP of the 4th IPCC Assessment Report. This is to ensure comparability with previous years. Due to the change of the calculation rules based on the European Governance Regulation, the data as of 15.03.23 are converted in accordance with the GWP of the 5th IPCC Assessment Report. This means that e.g. methane is weighted slightly higher and nitrous oxide slightly lower compared to carbon dioxide.
Further information
The 2.5 million tonnes of CO2 equivalents less than what has been published in 2021 emissions data as required by the Climate Change Act (see press release 15/2022 of 15.03.2022) are due to updates of the preliminary statistics available at that time.
In accordance with the Climate Change Act, UBA will present the official estimate for 2022 emissions in mid-March 2023.

