Air quality 2020: Only a few cities still exceed nitrogen dioxide limit
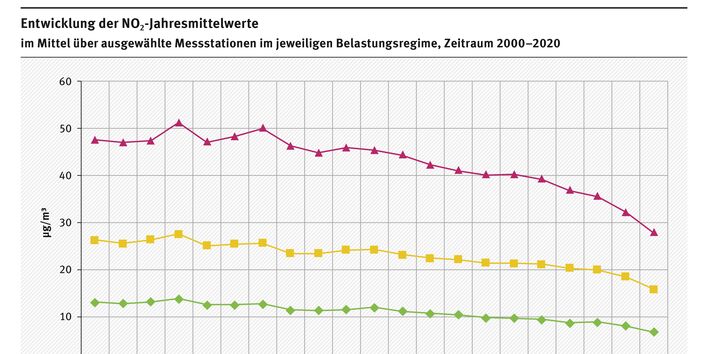
Measured concentrations of nitrogen dioxide (NO2) in 2020 exceeded the annual mean limit of 40 µg/m³ of air at only about 3 to 4 percent of measuring stations located near road traffic, compared to 21 percent in 2019. Nitrogen dioxide pollution overall continues to decline throughout Germany. These are the results of a preliminary evaluation of measurement data collected by the federal states and the German Environment Agency (1 February 2021) at some 400 measuring stations.
Whereas 25 cities were still exceeding the NO2 limit value in 2019, there will be well under ten in 2020. According to the evaluation of the data that is already available from the automatically measuring stations, Munich and Hamburg are definitely above the limit value with an annual mean value of 54 and 41 micrograms of NO2 per cubic metre of air, respectively. However, after evaluation of the data from around 140 passive collectors which have to be analysed in the laboratory and whose results will not be available until May, additional cities such as Stuttgart are expected to exceed the limit values.
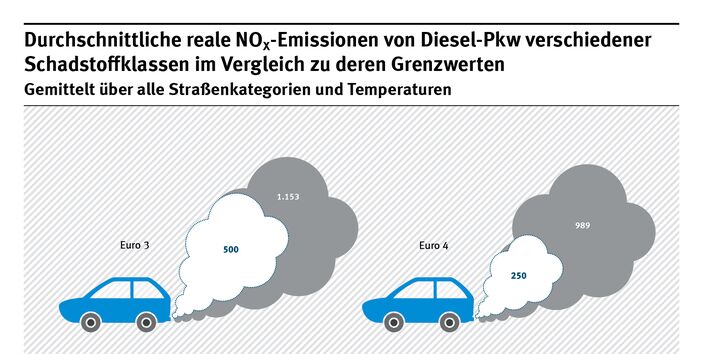
President Dirk Messner of the German Environment Agency (UBA) said, “It is encouraging to see that the positive development of the last few years is continuing. However, it must also be said that Germany should be complying since 2010 with the limit value for the protection of human health, which was adopted back in 1999. The fact that newly registered diesel cars have only recently been complying with the limit values on the road is the main reason for the plight of the last ten years or so." Road traffic is the main source of nitrogen oxides in cities, especially diesel cars. Only modern diesel cars with the Euro 6d-TEMP and Euro 6d emission standards emit significantly less nitrogen oxides - not only on the test bench, but also on the road. Modelling by the UBA shows that software updates and fleet renewal together resulted in a significant reduction of around three micrograms of NO2 per cubic metre in 2020. Around two-thirds of this is attributable to the new, much cleaner vehicles, and one-third to the software updates. "If all vehicles on German roads had complied with the emission limit values in actual operation, there would have been no more exceedances in 2020. It is also unfortunate that software updates have dragged on so long and that there have been few hardware retrofits," said Messner.
In addition to direct improvements to vehicles, mean NO2 concentrations at measuring stations located close to road traffic fell by a further microgram on average due to local measures such as speed limits and driving bans as well as the use of cleaner buses, meteorological influences that favour or exacerbate the spread of air pollutants and – to a lesser extent – the measures taken to contain the coronavirus pandemic.
The NO2 concentrations measured at urban stations near road traffic decreased during the first lockdown in spring 2020, by an average of 20 to 30 per cent. This is shown by evaluations in which meteorological influences were factored out. However, depending on the particular drop in traffic and the meteorological background conditions, the decline varied greatly from region to region and from location to location. Since the traffic decrease due to the lockdown was mainly limited to a period of four weeks (23 March to 19 April), the effect on the annual mean NO2 values is minor and the corresponding decrease should be about one microgram NO2 per cubic metre of air or less.
Some municipalities also use air filtration systems or close lanes directly in front of the measuring stations to improve air quality. Dirk Messner says, "We want to improve the air in our cities permanently and significantly. A temporary reduction in traffic volume is no more a part of this than are filter systems that only purify the air in the immediate vicinity of the air monitoring station. Such systems which are installed in some cities reduce the concentrations directly on site but they do not contribute to good air quality across the board."
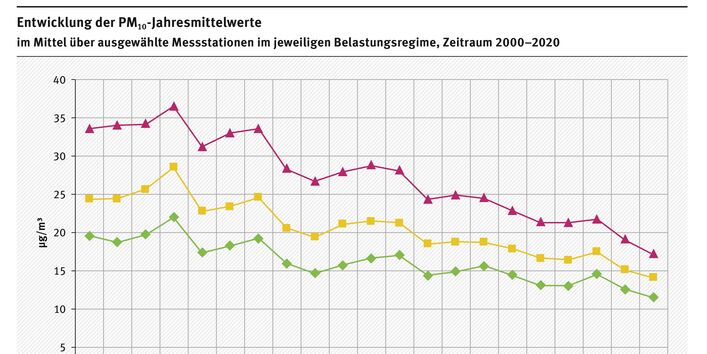
Particulate matter: 2020 marked the lowest levels of particulate pollution since measurements began in the late 1990s. There was compliance throughout the country with particulate matter limit values for PM10 and PM2.5. However, the limit values for particulate matter in effect are more than 20 years old and need to be adjusted to the latest scientific findings by the World Health Organization (WHO). The WHO is currently revising its recommendations to ensure better protection of health. The current WHO guideline states that PM10 concentrations should not exceed an annual mean of 20 µg/m3. In 2020, approximately four percent (2019: 13 percent) of all measuring stations failed to comply with this recommendation. The WHO recommendation on daily mean values (no more than three days per year above 50 µg/m³ as a daily mean) was not followed by around 12 percent (2019: 36 percent) of all measuring stations in Germany. The WHO guidelines for the even smaller PM2.5 particulate matter were exceeded even more significantly than those for PM10 in 2020. At 86 per cent of all stations, PM2.5 daily mean values were above the threshold of 25 µg/m³ on more than 3 days, and 11 per cent exceeded the threshold of 10 µg/m³ as the yearly average. The EU-wide limit value is 25 µg/m³.
The unusually low particulate matter load in 2020 is linked to an extremely mild and wet winter. According to the German Meteorological Service, the winter of 2020 was the second warmest since records began, and the months of November and December were also milder than normal. However, it is precisely during typical, wintry weather episodes that particulate matter levels are high. In such weather conditions, it cannot be ruled out that the PM10 daily mean limit value will be exceeded in the future.
The measures to contain the coronavirus pandemic had only a minor impact on particulate matter concentrations, given that road traffic contributes much less to particulate matter pollution than nitrogen oxides.
Particulate matter has a significant impact on health. According to estimates by the European Environment Agency, around 63,100 premature deaths and a corresponding 710,900 years of life lost in Germany in 2018 could be attributed to the population's exposure to PM2.5. At 9,200 and 4,000 premature deaths – or 103,500 and 46,600 years of life lost, respectively – a much lower burden of disease was found for NO2 and ozone. Dirk Messner said: "In view of the positive development of nitrogen dioxide, the central challenge now lies in reducing particulate matter pollution. Further efforts are needed by the federal, state and local governments to curb the health risk posed by particulate matter. In this context, we need to pay special attention to non-combustion-related particulate emissions from the abrasion of brake discs, clutches and tyres, to emissions from wood-burning systems and to secondary particulate pollution from ammonia emissions from agriculture.”
Ozone: Compared to the last 20 years, 2020 was a year with below-average ozone pollution. The alert threshold of 240 µg/m³ was not exceeded. The information threshold of 180 µg/m³ was exceeded on 13 days.
The frequency with which the information threshold is exceeded varies greatly from year to year. The 2003 "summer of the century" is a clear example. The reason for the strong fluctuations in ozone peaks over the years is the strong correlation of ozone concentrations with the weather. Unlike particulate matter and nitrogen dioxide, ozone is not emitted directly, but rather formed from certain precursors (nitrogen oxides and volatile organic compounds) during intense solar radiation. During prolonged summertime high-pressure weather conditions, the ozone formed in this way can accumulate in the lower layers of the atmosphere and result in increased levels there.
As in the previous year, the long-term health protection target (maximum 120 µg/m³ average over an eight-hour period) was exceeded at all 260 stations, on an average of 17 days per station. The WHO recommendation to not exceed 100 µg/m3 as an 8-hour average was also missed by a wide margin, as in the previous year.


