Skip to main content Skip to main menu Skip to footer

HUE-4: Adaptation to climate change at the municipal level

The illustration HUE-4 ’Climate adaptation at the municipal level’ contains a biaxial chart. The stacked columns show – for 2012, 2014, 2016 and 2021 respectively – the proportion of respondents in per cent in terms of their opinion whether the extent of precautionary measures taken at municipal level is sufficient.
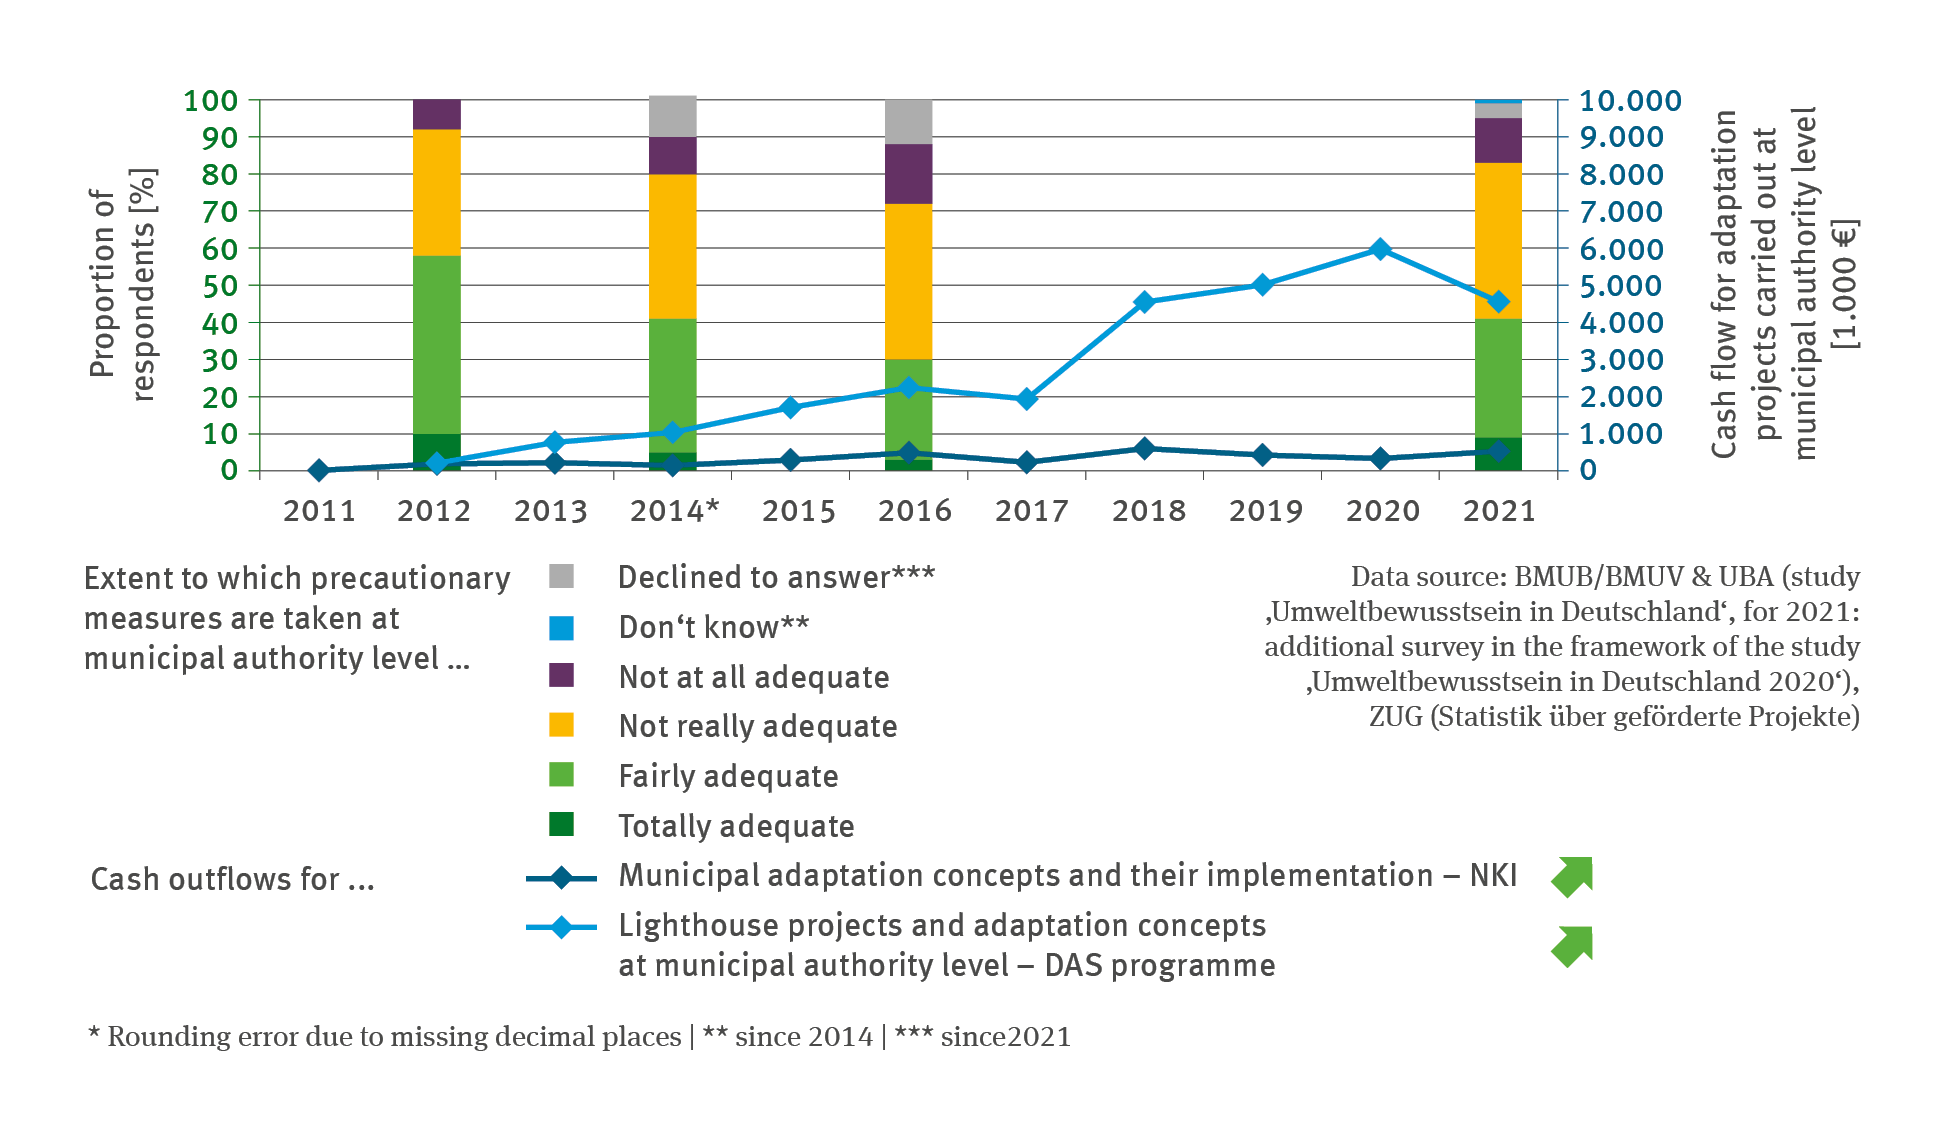
Source: BMUB/BMUV & UBA (study ‚Umweltbewusstsein in Deutschland‘/ for 2021: additional survey in the framework of the study ‚Umweltbewusstsein in Deutschland 2020‘)/ ZUG (Statistik über geförderte Projekte)
Download image (173.21 kB)

The following contents contain this medium:

Tags

Short link: www.uba.de/m42706en