Skip to main content Skip to main menu Skip to footer

FW-I-2: Incremental growth in timber

The XY scatter chart FW-I-2 ’Incremental growth in timber’ shows dots representing the annual incremental growth on the area of ground (growth in thickwood with bark) in square metres per hectare and year, differentiated by the following tree species: spruce, beech, oak and pine, for the periods of 2002 to 2008, 2008 to 2012 and 2012 to 2017 respectively. As yet, there are no data available for the years of 2017 to 2022. The incremental growth rates for beech, oak and pine trees have declined since 2002.
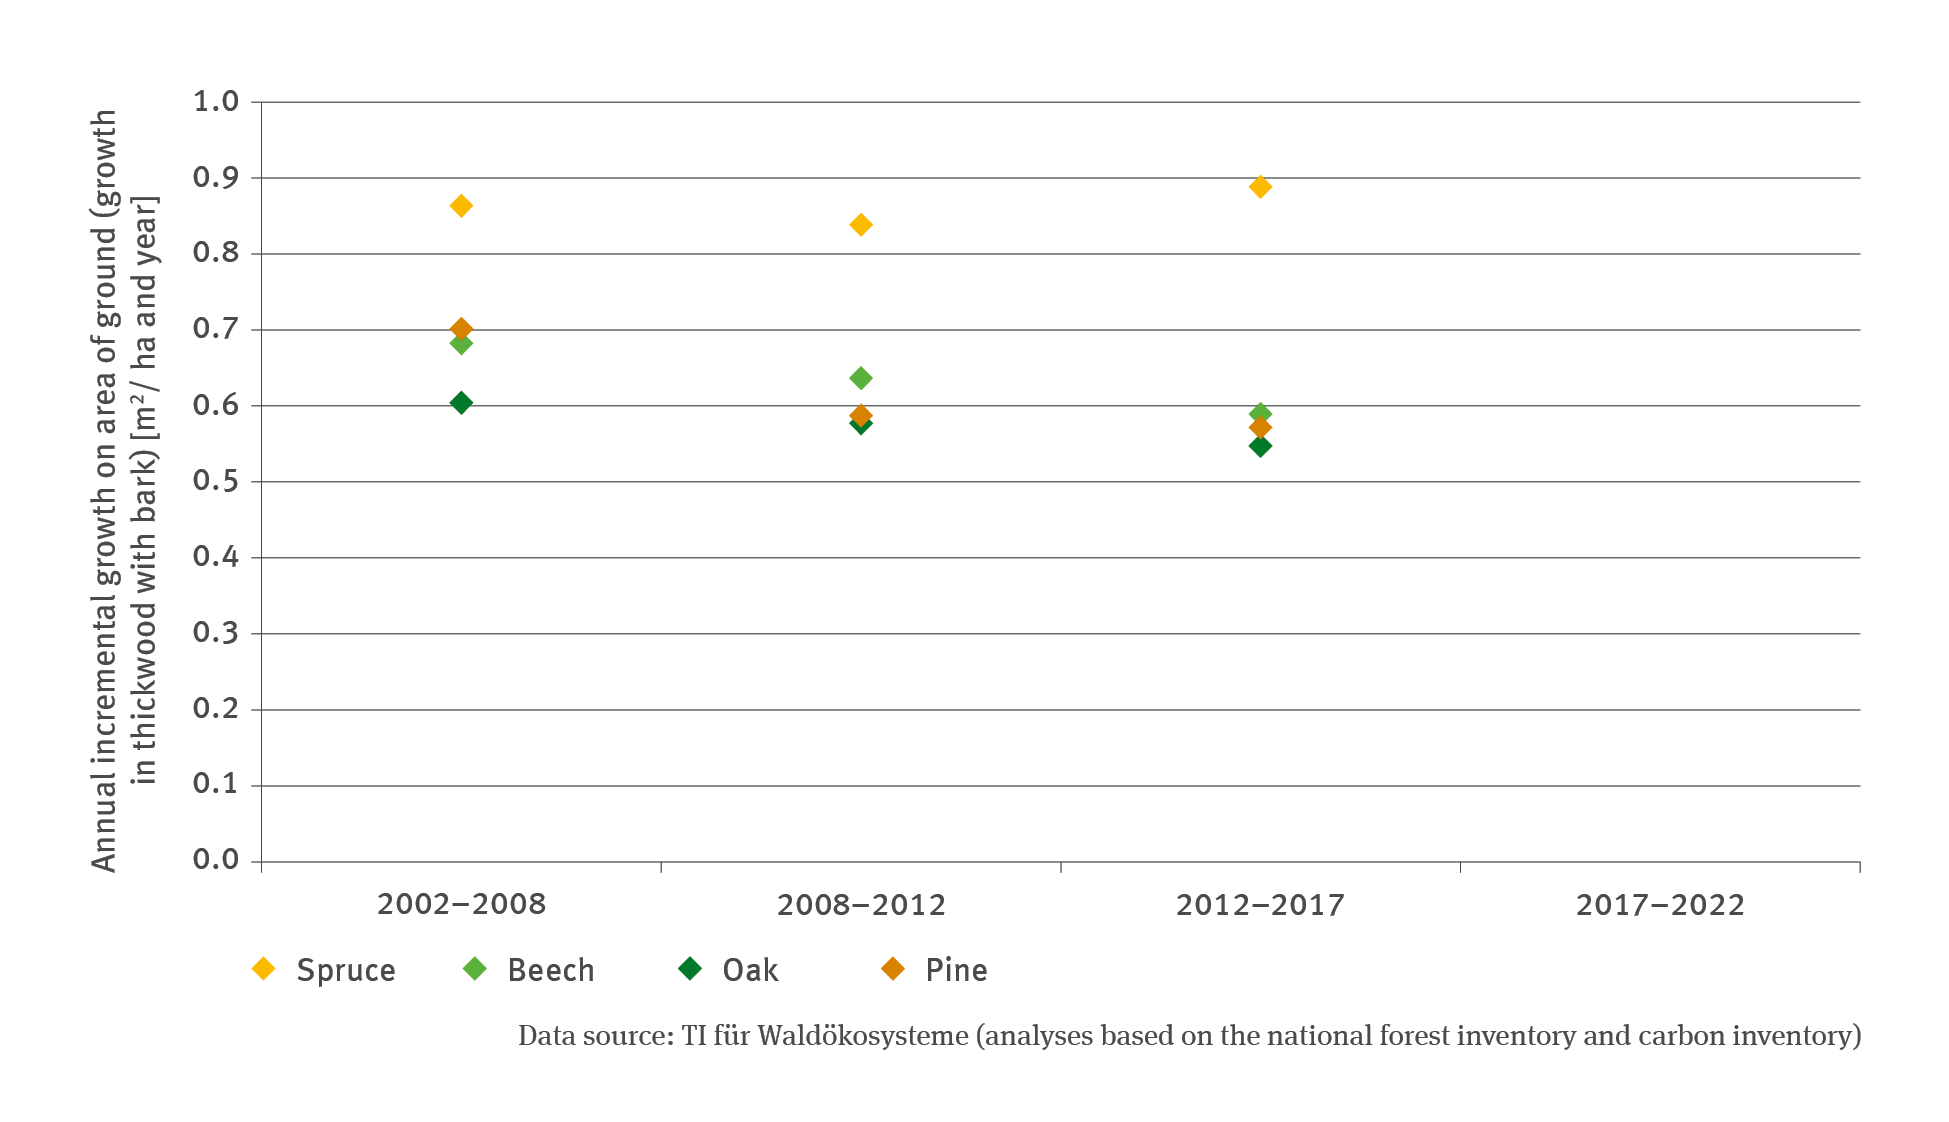
Source: TI für Waldökosysteme (analyses based on the national forest inventory and carbon inventory)
Download image (72.74 kB)

The following contents contain this medium:

Tags

Short link: www.uba.de/m42833en