Skip to main content Skip to main menu Skip to footer

BAU-R-2: Green roofs in cities

The illustration shows a biaxial diagram. For 2020 the green roof area in 15 cities with a population in excess of 500,000 inhabitants per square metre per inhabitant is illustrated by a bar chart. In addition, the percentage of green roof area in respect of the overall roof area examined is illustrated in dot form. In 2020 the green roof area amounted to 0.8 square metres per inhabitant and to approximately 10 per cent of the overall roof area examined.
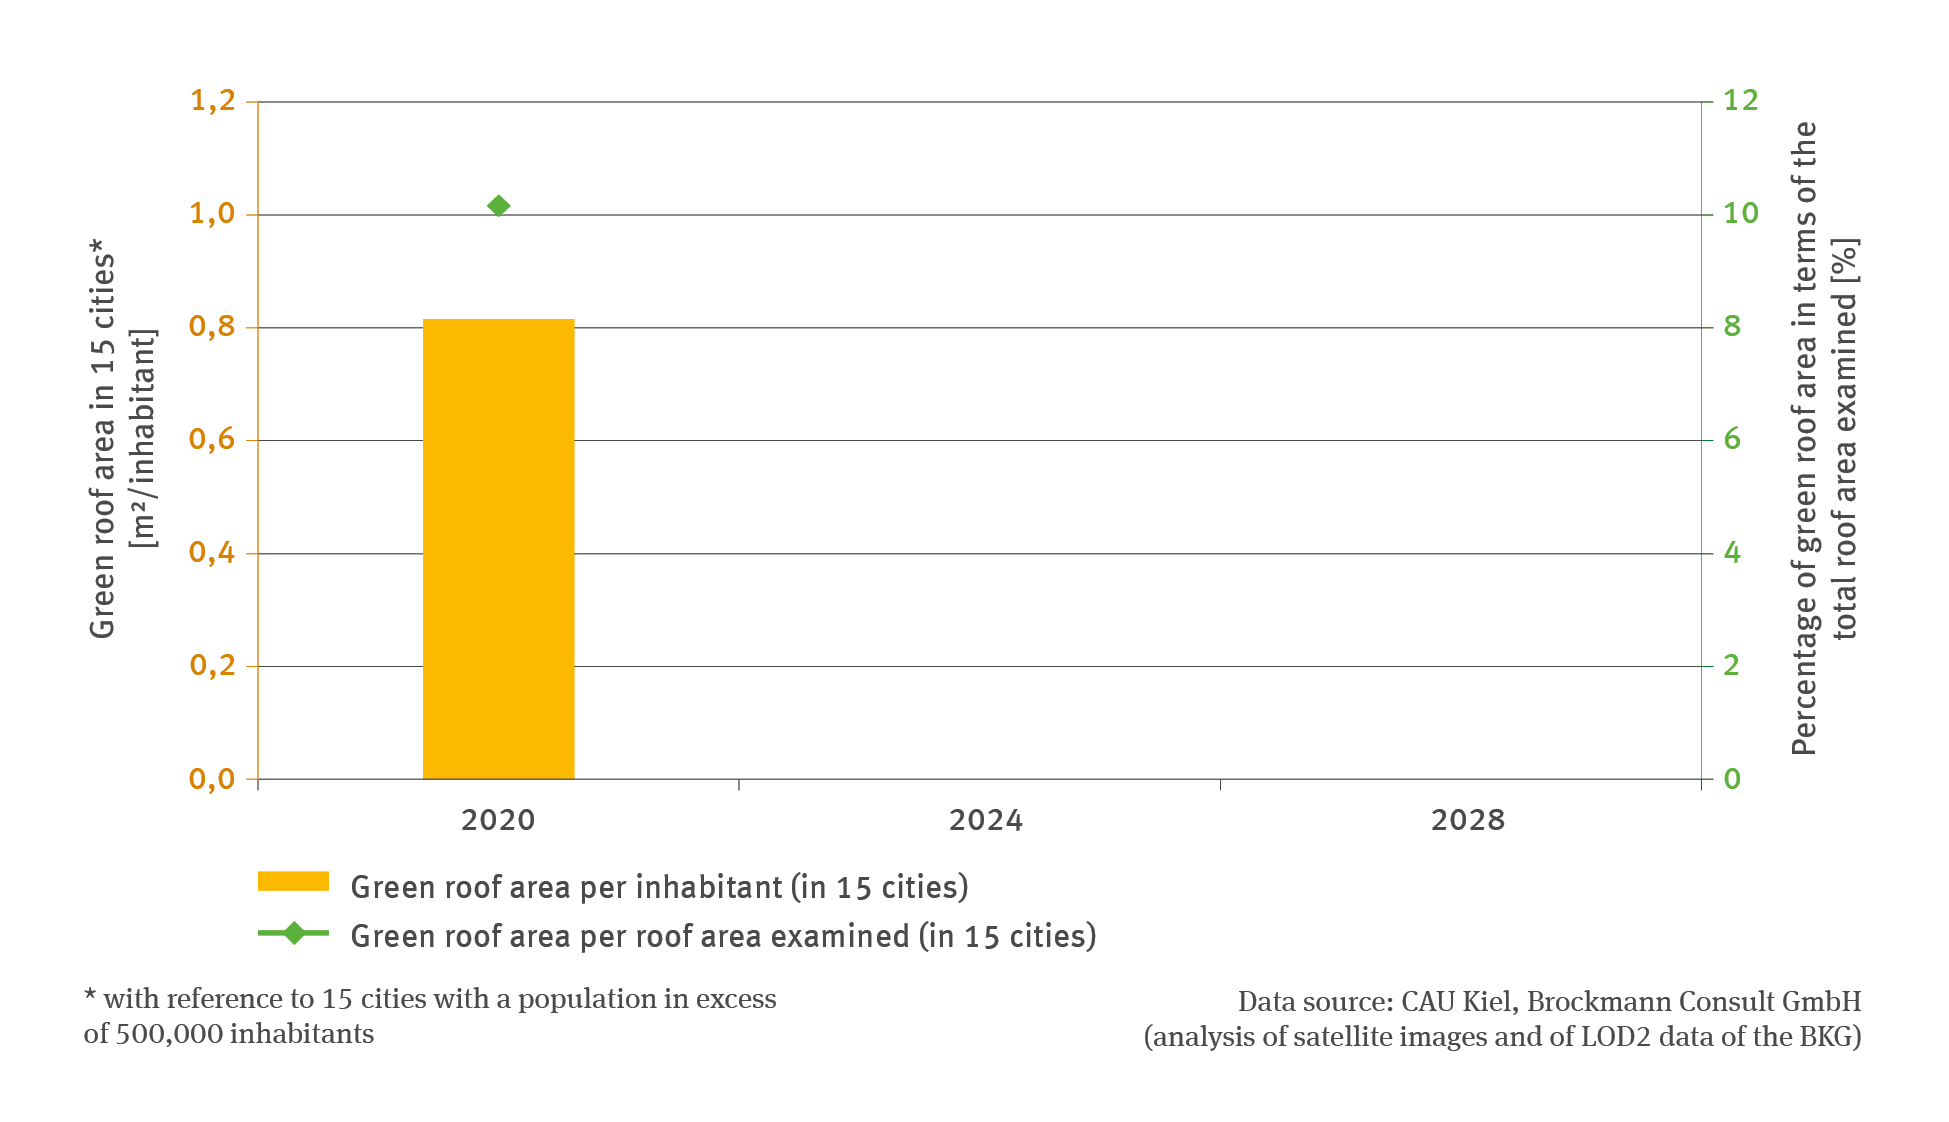
Source: CAU Kiel; Brockmann Consult GmbH (analysis of satellite images and of LOD2 data of the BKG)
Download image (91.49 kB)

The following contents contain this medium:

Tags

Short link: www.uba.de/m42700en