Data Search

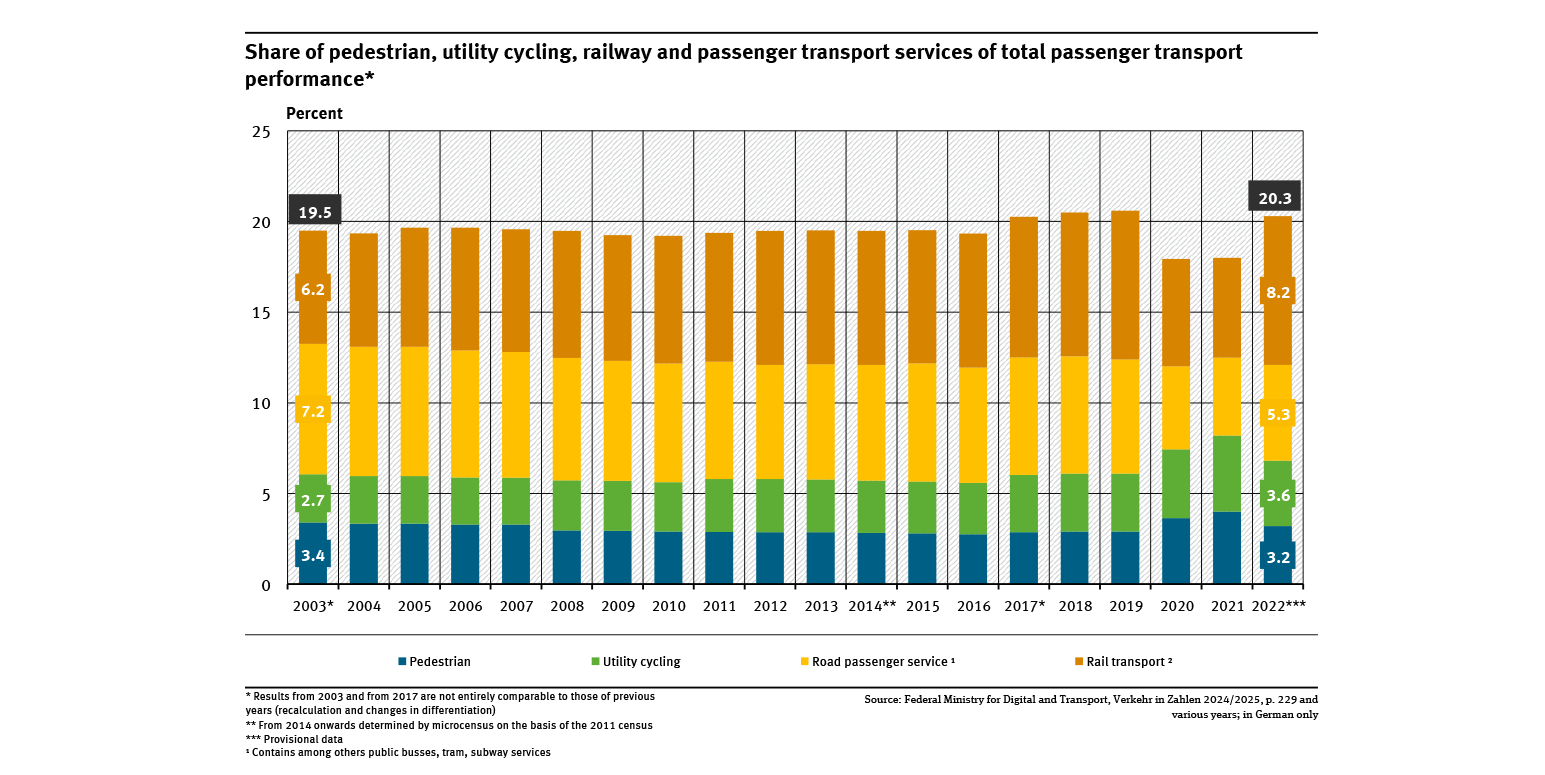
Share of pedestrian, utility cycling, railway and passenger transport services ...
- Verkehr
- Diagramme
- Umwelt-Indikatoren
- Daten und Tabellen

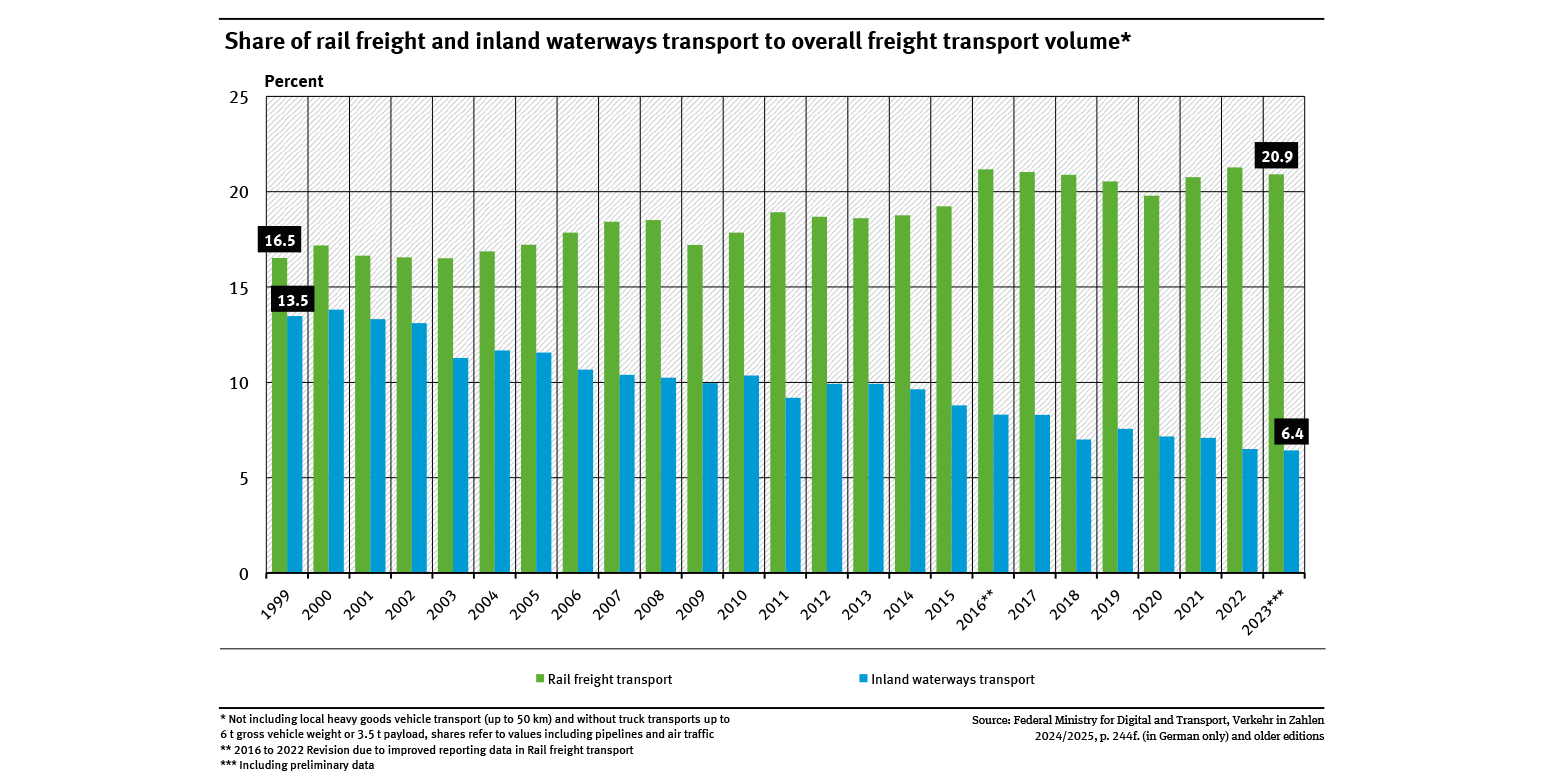
Share of rail freight and inland waterways transport to overall freight transport volume
- Verkehr
- Diagramme
- Umwelt-Indikatoren
- Daten und Tabellen

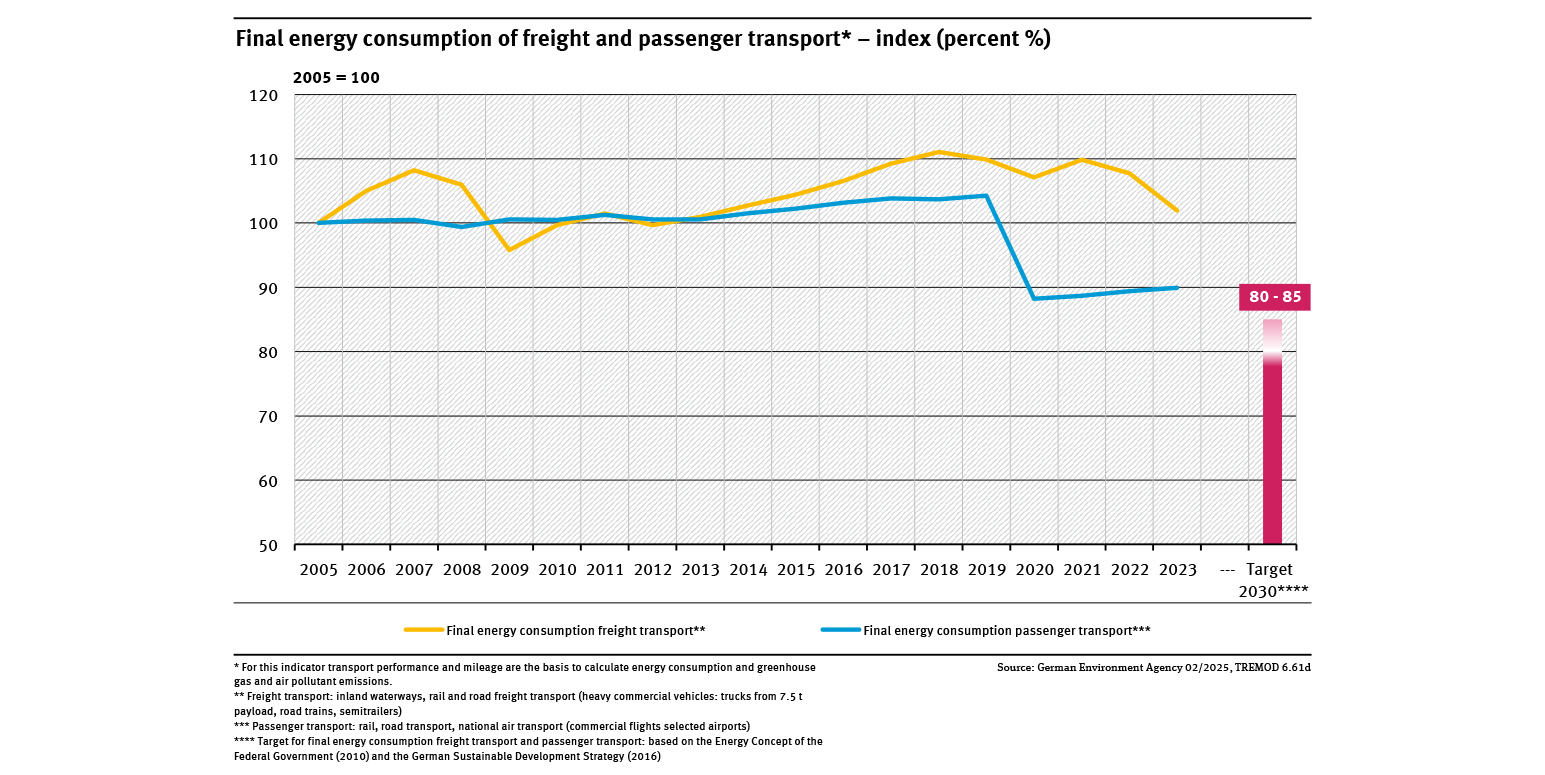
Final energy consumption of freight and passenger transport
- Energie
- Verkehr
- Diagramme
- Umwelt-Indikatoren
- Daten und Tabellen

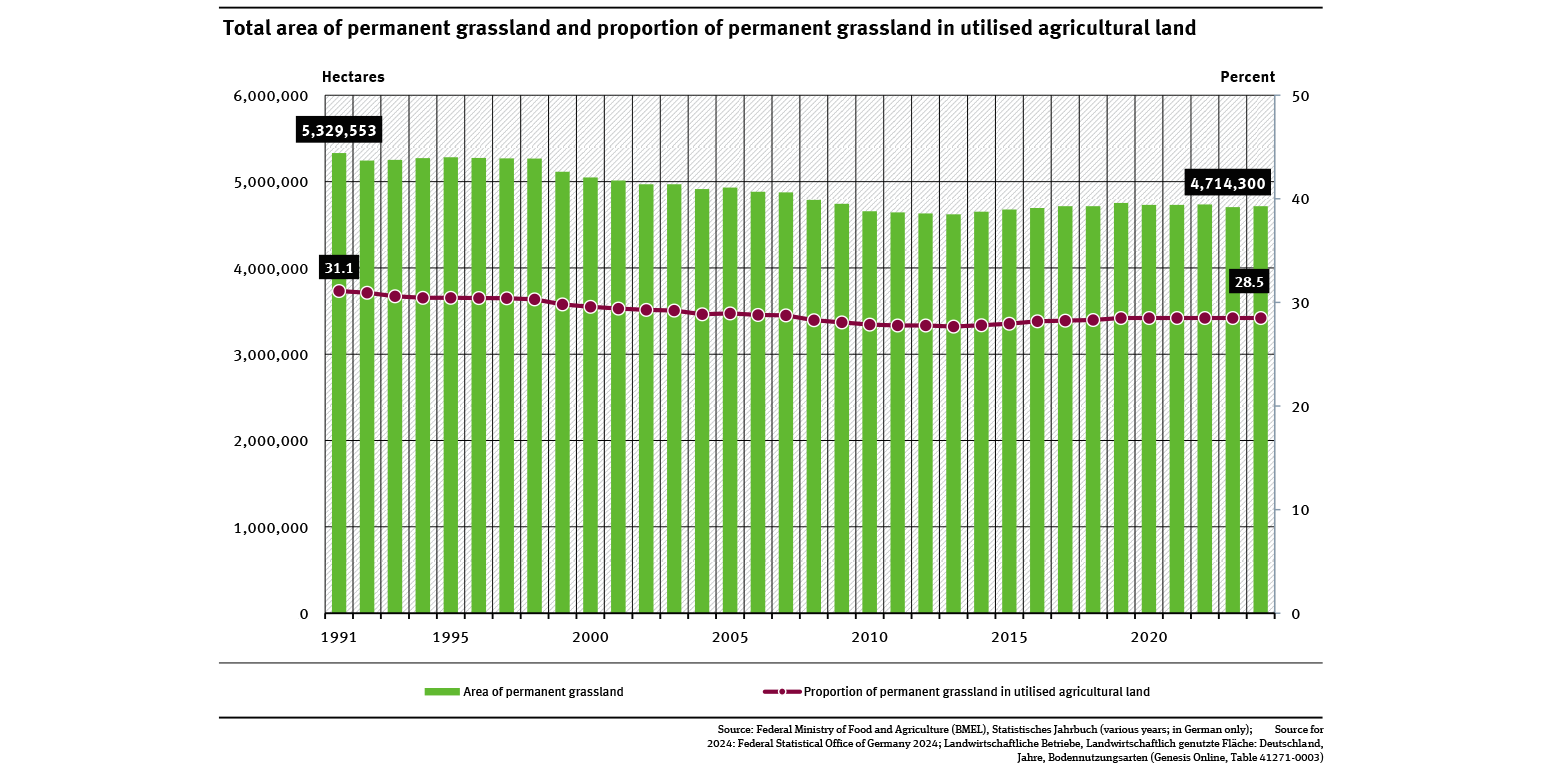
Total area of permanent grassland and proportion of permanent grassland ...
- Land- und Forstwirtschaft
- Diagramme
- Umwelt-Indikatoren
- Daten und Tabellen

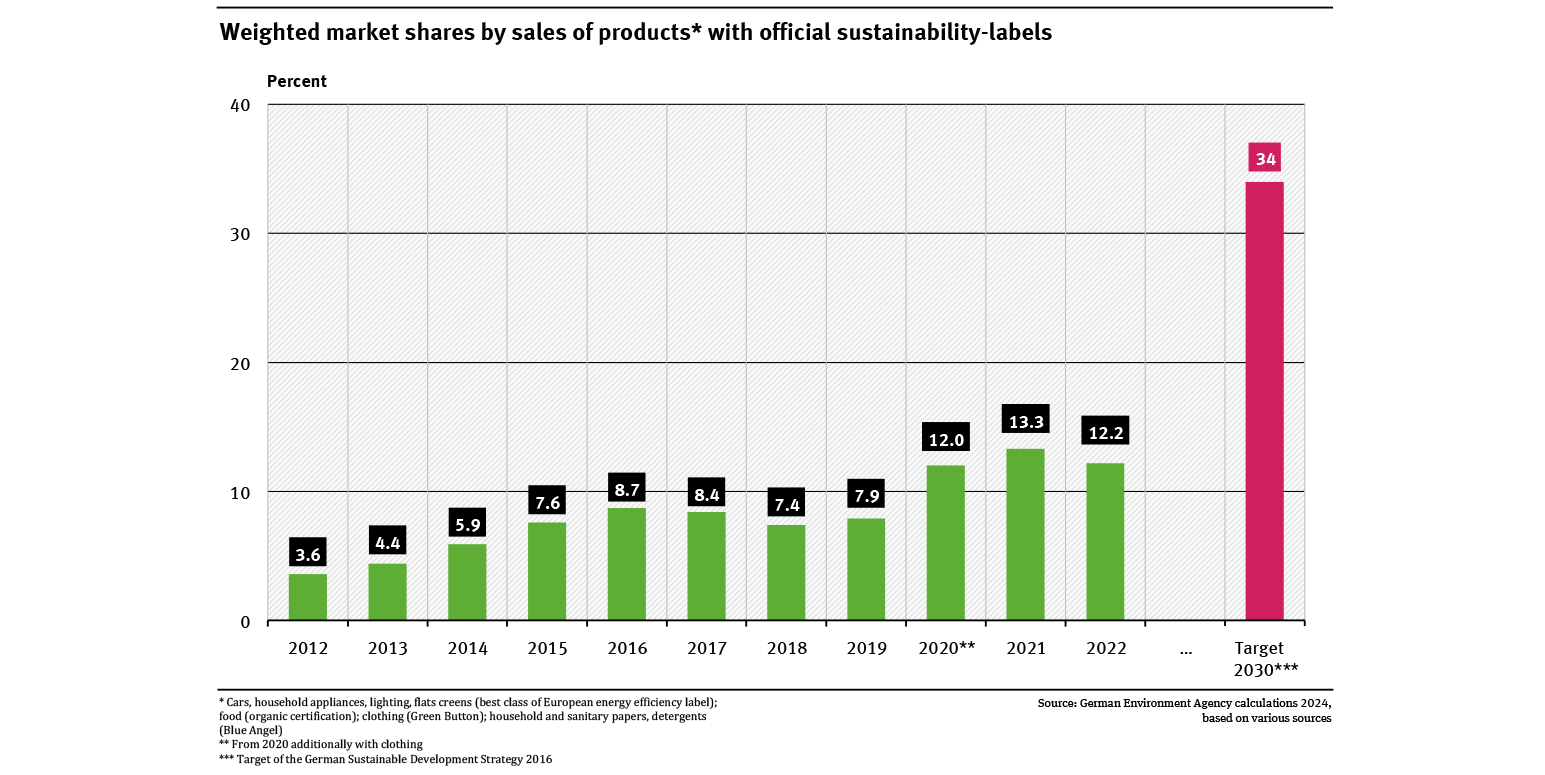
Weighted market shares by sales of products with official eco-labels
- Private Haushalte und Konsum
- Diagramme
- Umwelt-Indikatoren
- Daten und Tabellen

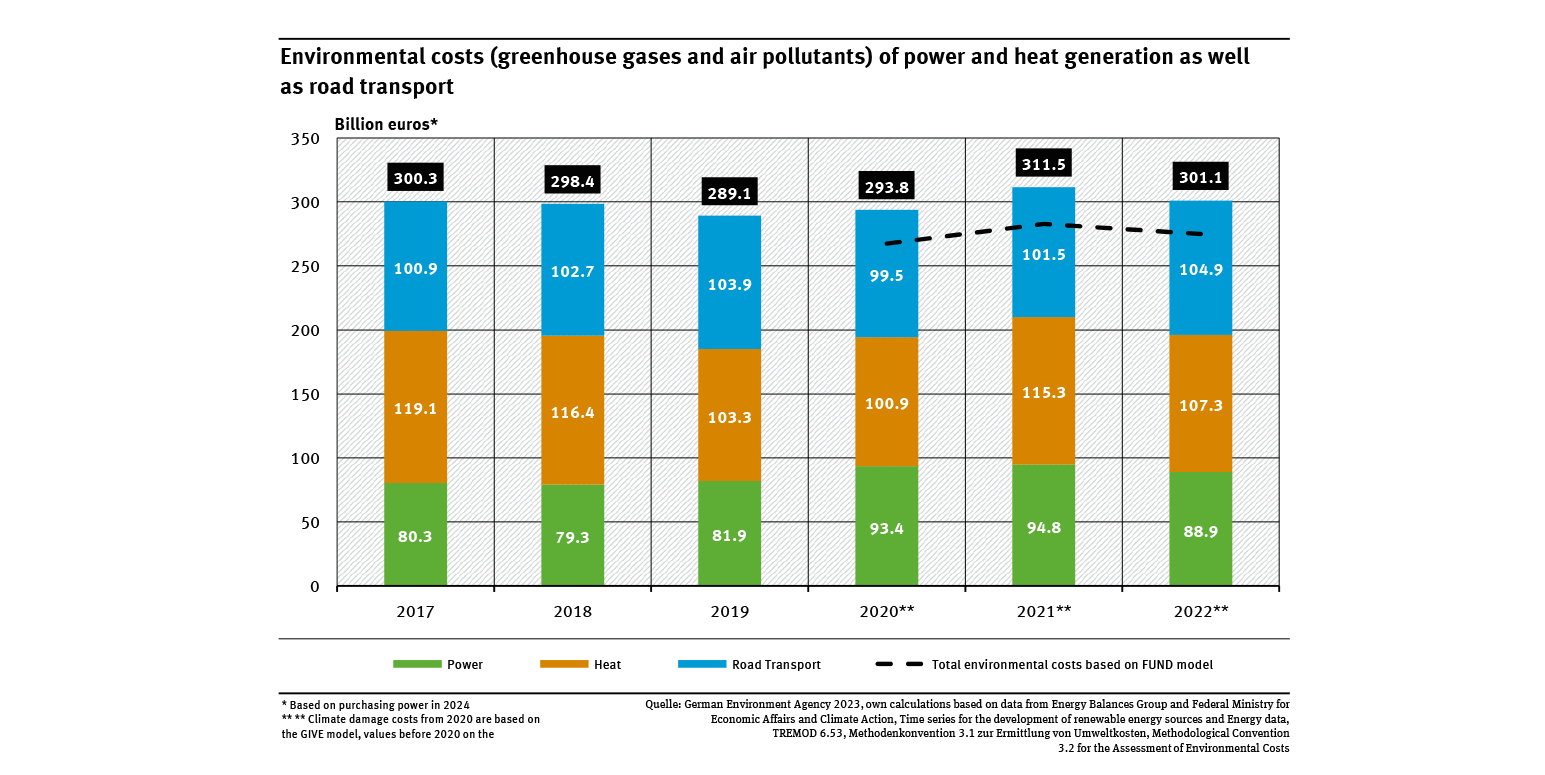
Environmental costs (greenhouse gases and air pollutants) of power and heat generation ...
- Luft
- Umwelt und Wirtschaft
- Diagramme
- Umwelt-Indikatoren
- Daten und Tabellen

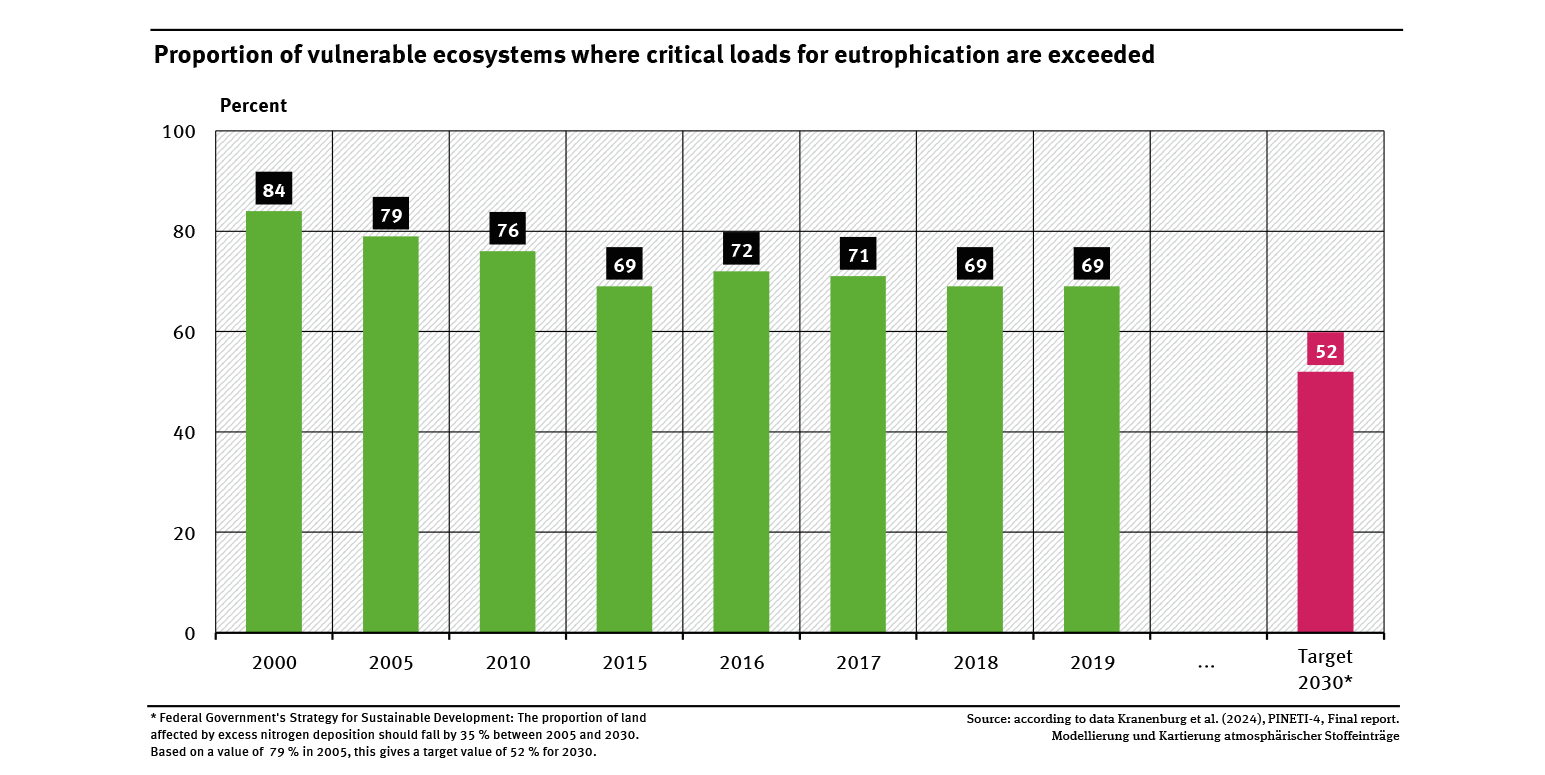
Proportion of vulnerable ecosystems where critical loads for eutrophication are exceeded
- Fläche, Boden, Land-Ökosysteme
- Diagramme
- Umwelt-Indikatoren
- Daten und Tabellen

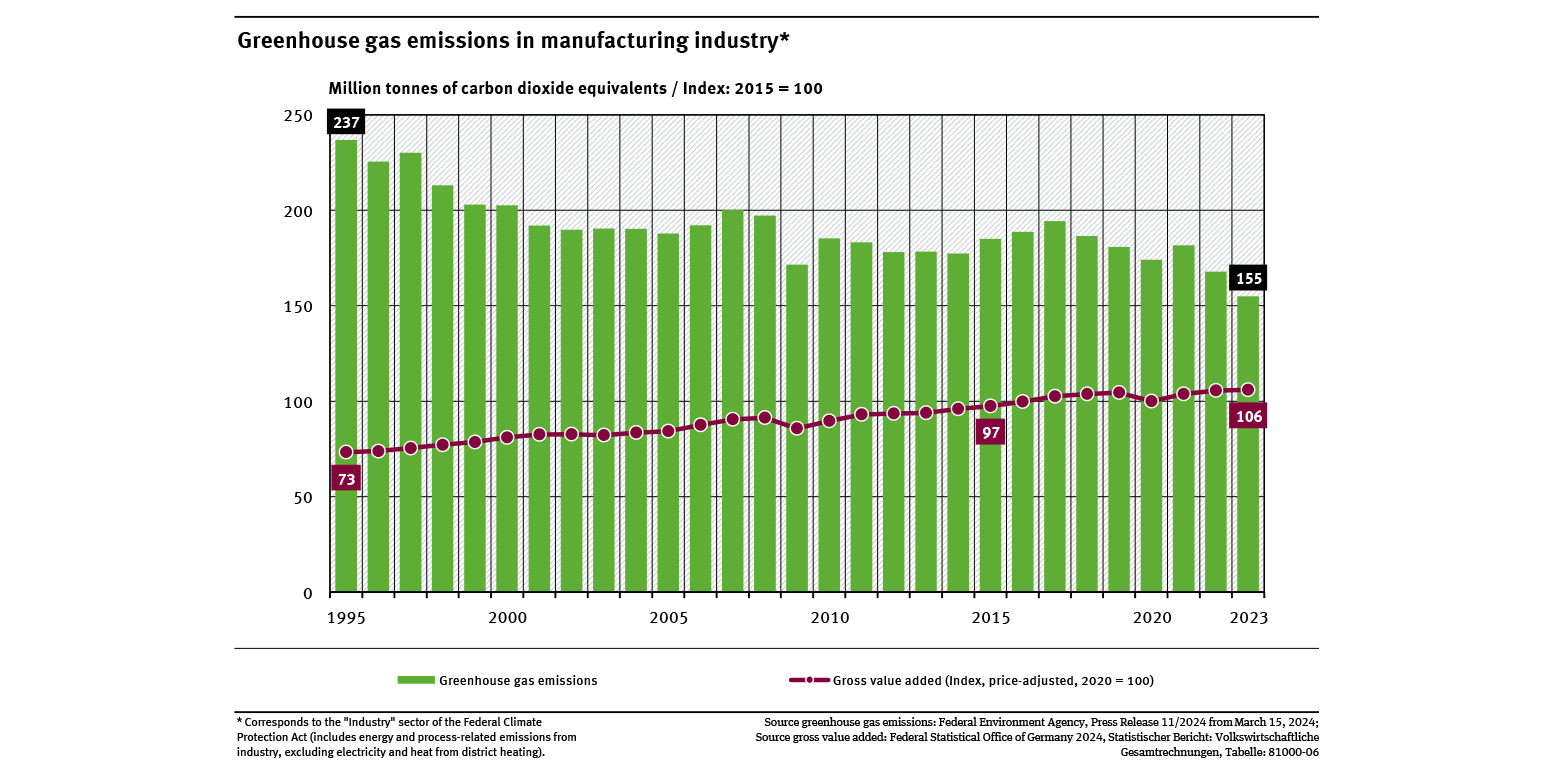
Greenhouse gas emissions in manufacturing industry
- Klima
- Umwelt und Wirtschaft
- Diagramme
- Umwelt-Indikatoren
- Daten und Tabellen

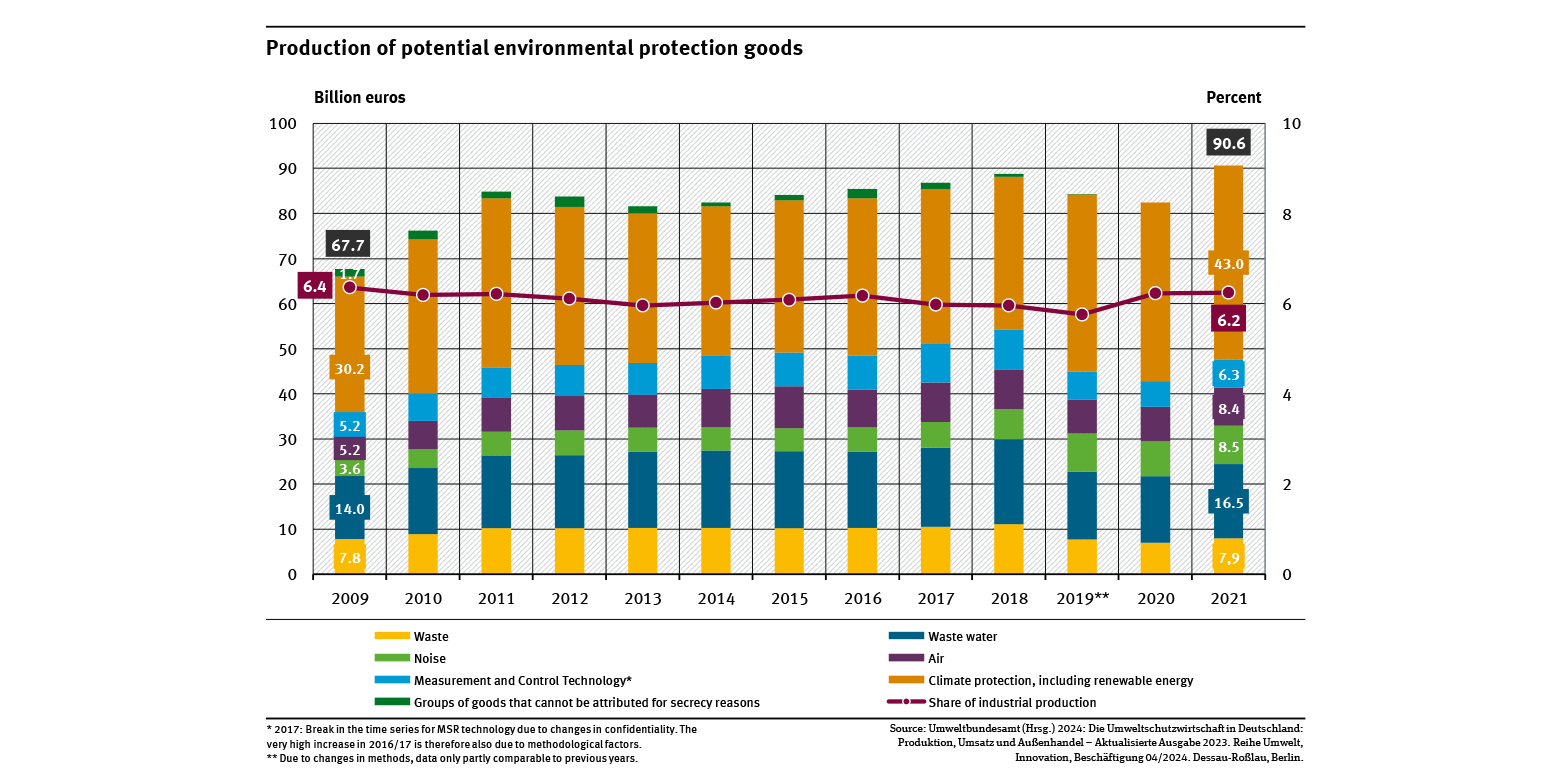
Production of potential environmental protection goods
- Umwelt und Wirtschaft
- Diagramme
- Umwelt-Indikatoren
- Daten und Tabellen

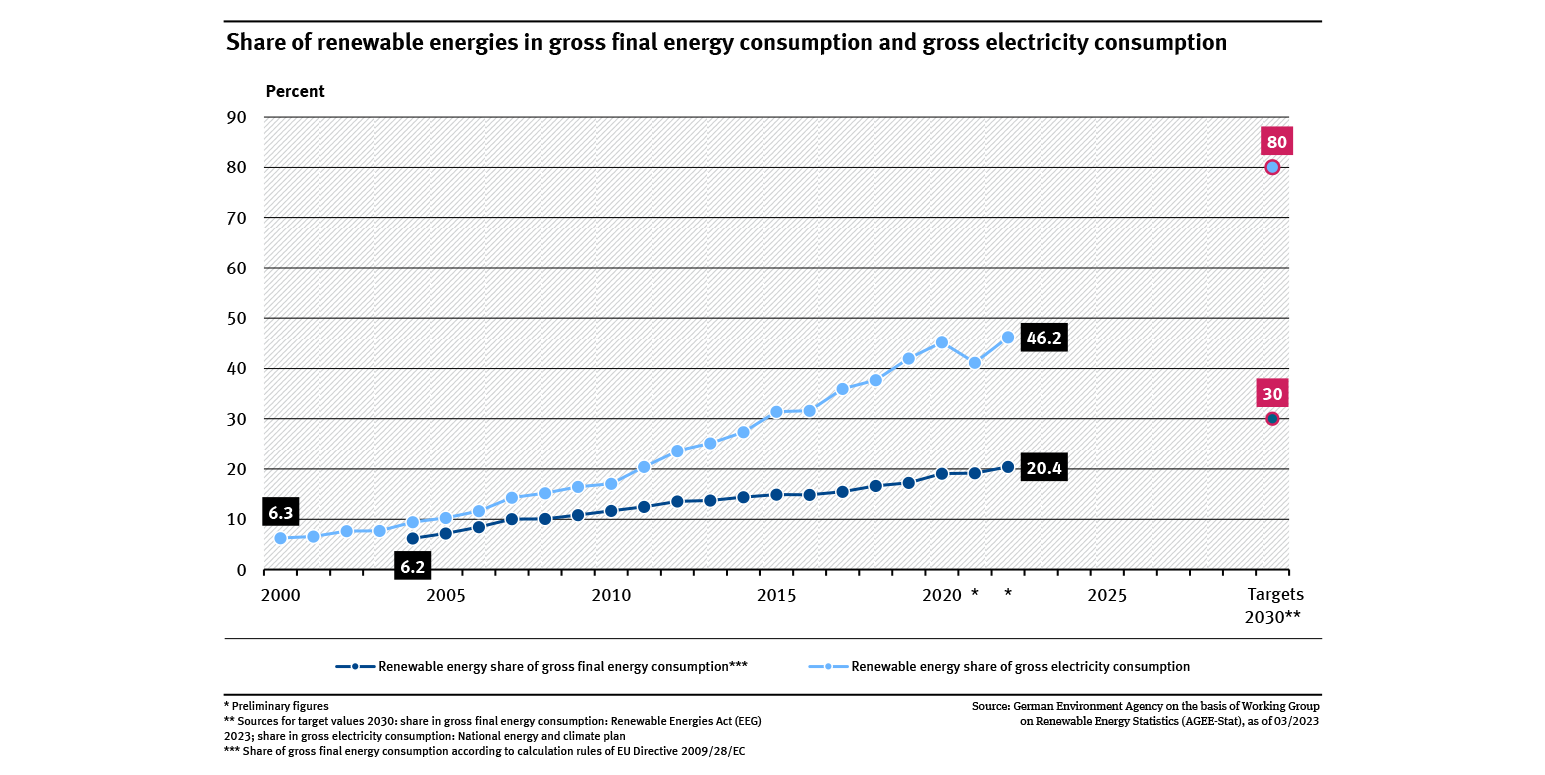
Renewable energy share in gross final energy consumption and gross electricity consumption
- Energie
- Diagramme
- Umwelt-Indikatoren
- Daten und Tabellen