Data Search

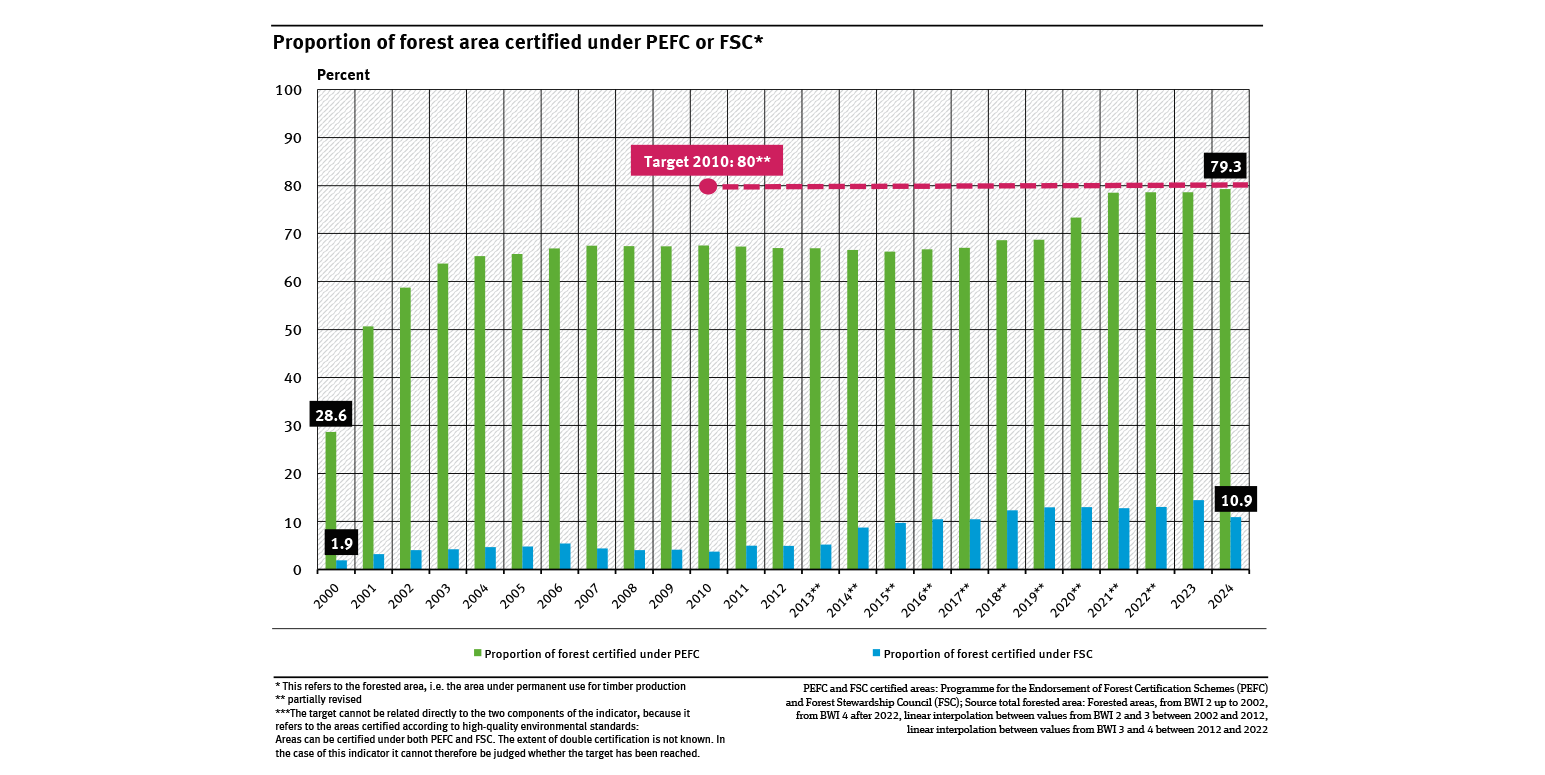
Proportion of forest area certified under PEFC or FSC
- Land- und Forstwirtschaft
- Diagramme
- Umwelt-Indikatoren
- Daten und Tabellen

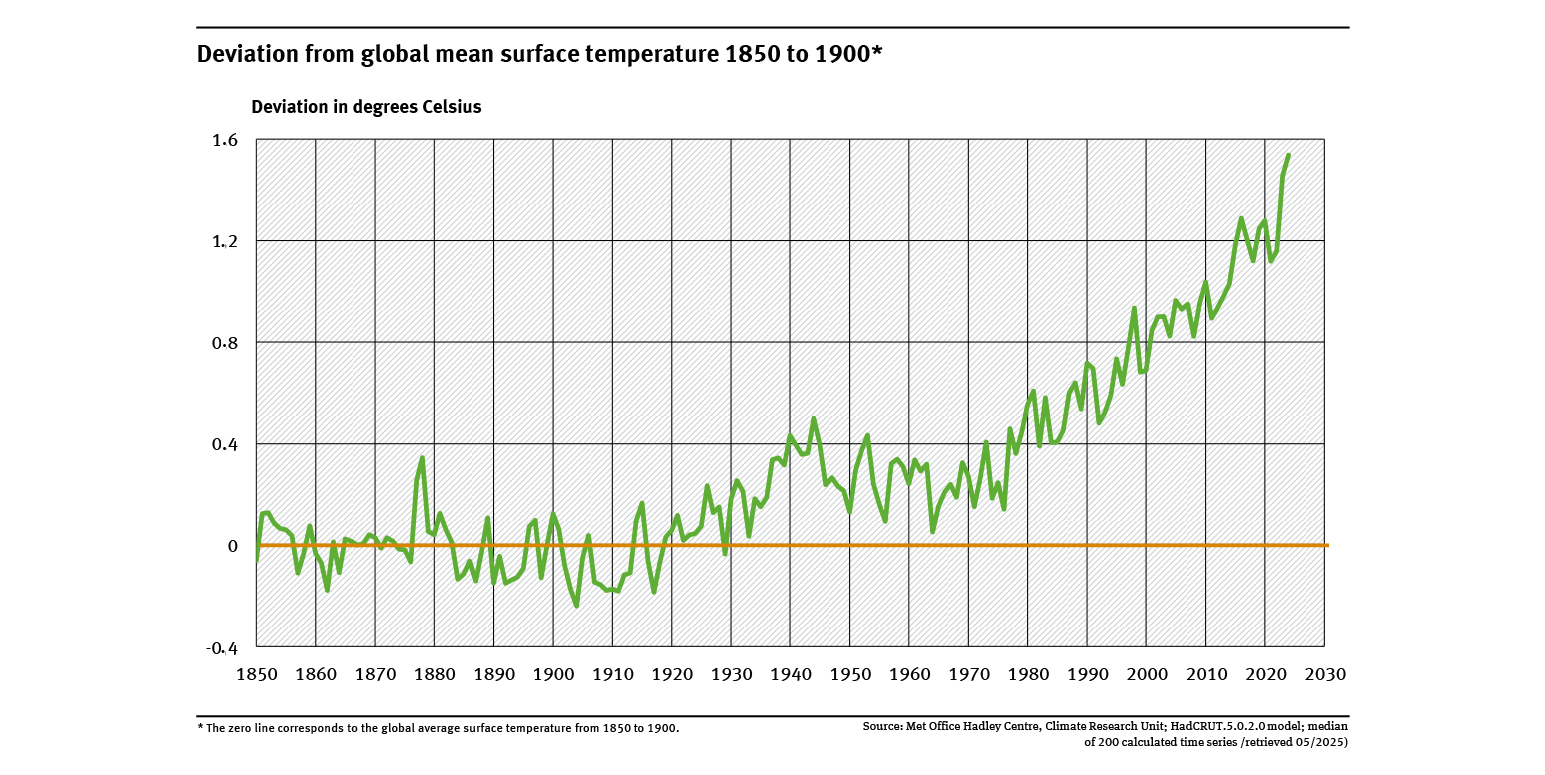
Deviation from global mean surface temperature 1850 to 1900
- Klima
- Diagramme
- Umwelt-Indikatoren
- Daten und Tabellen

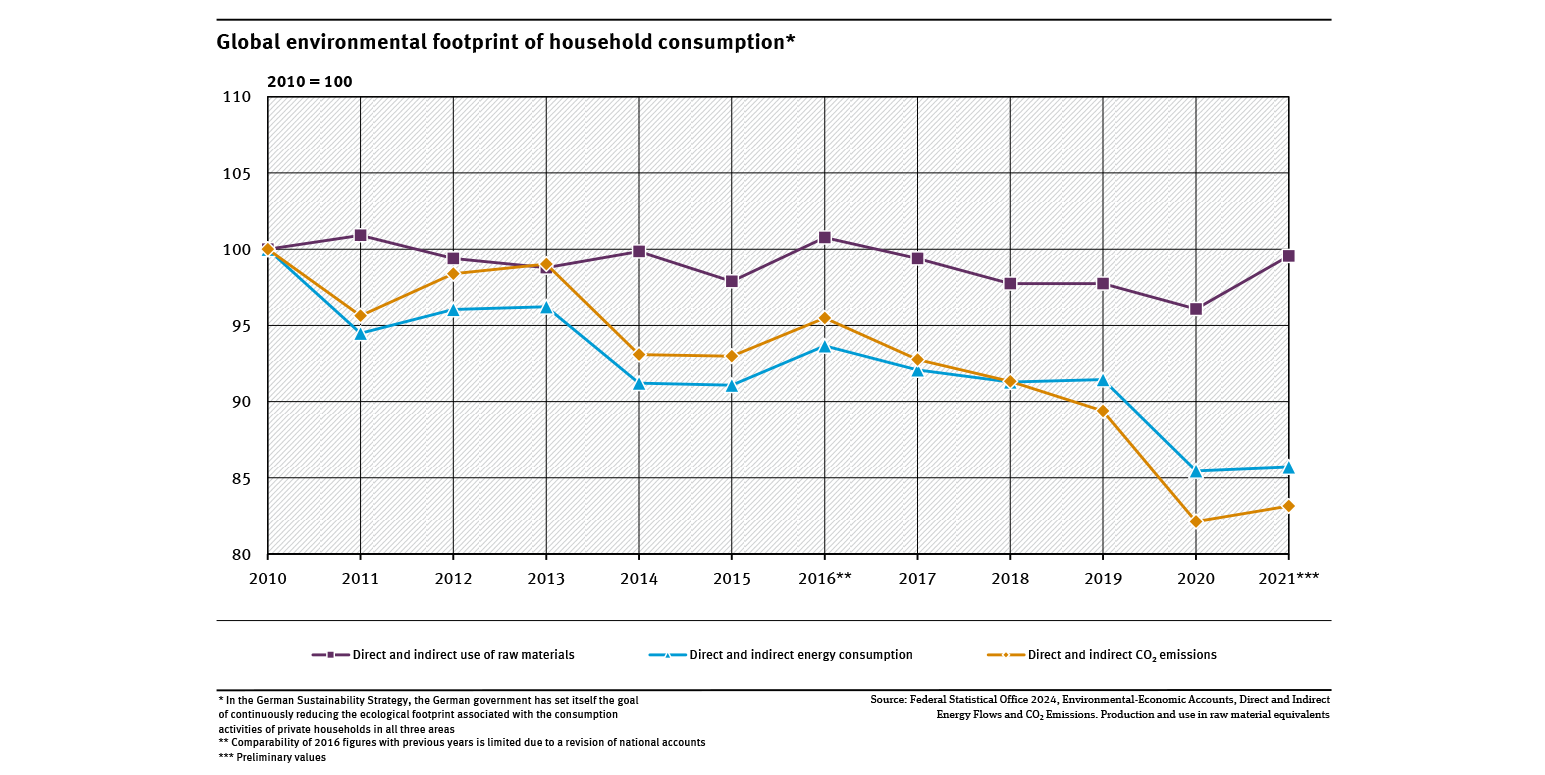
Global environmental footprint of household consumption
- Private Haushalte und Konsum
- Diagramme
- Umwelt-Indikatoren
- Daten und Tabellen

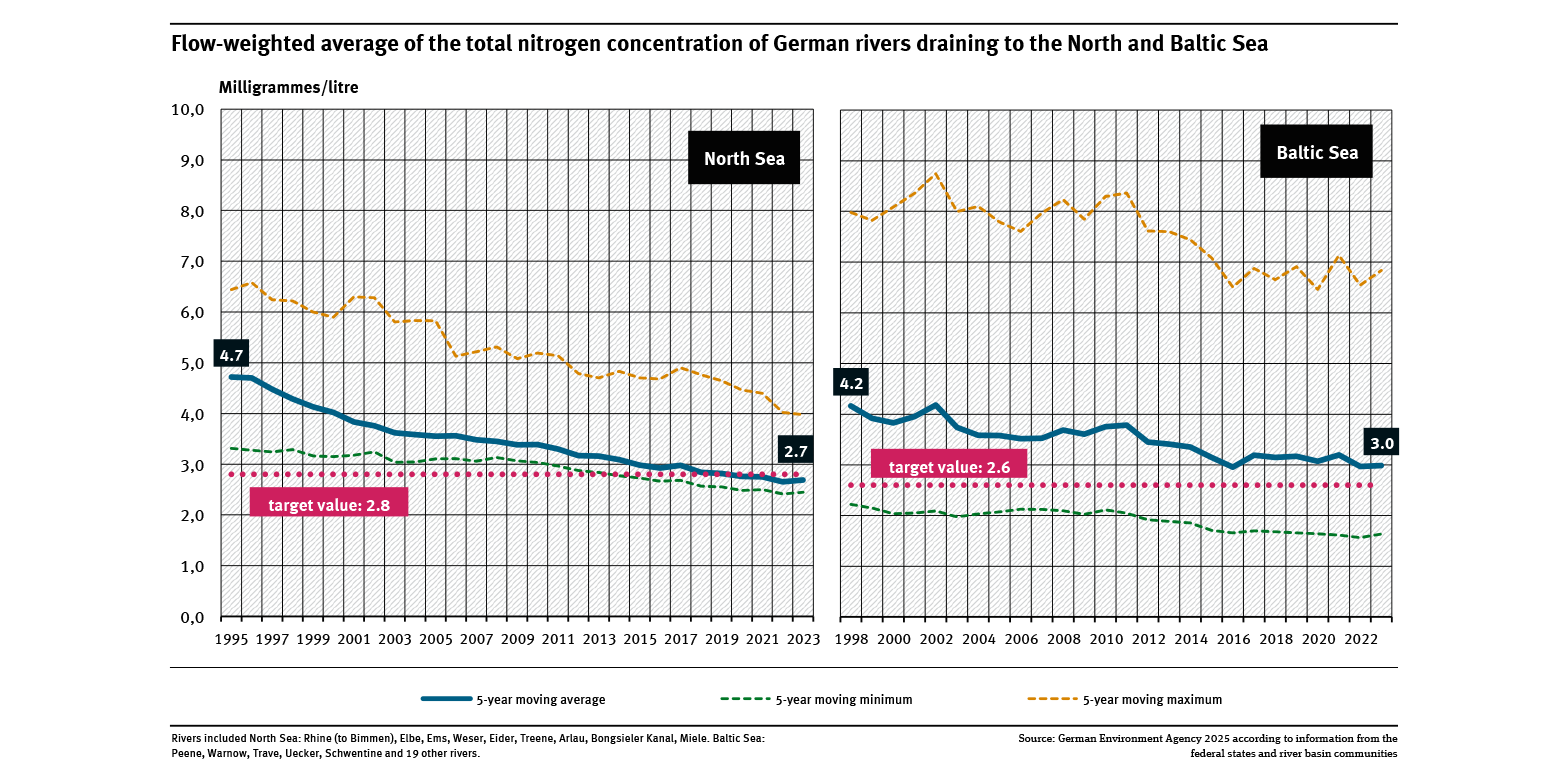
Outflow-weighted mean of the total nitrogen concentration of the North Sea and Baltic Sea inlets
- Wasser
- Diagramme
- Umwelt-Indikatoren
- Daten und Tabellen

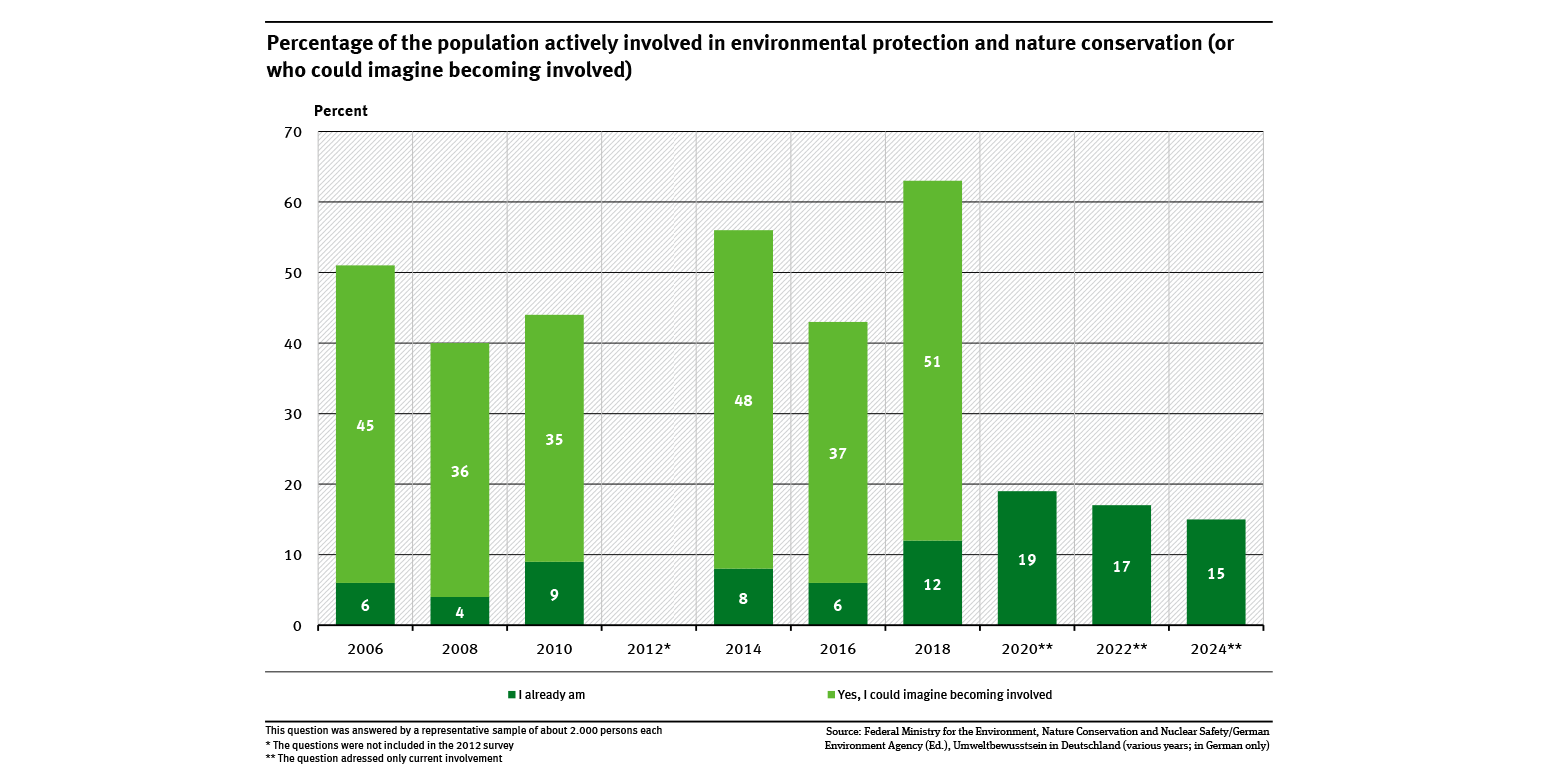
Percentage of the population actively involved in environmental protection and nature conservation..
- Private Haushalte und Konsum
- Diagramme
- Umwelt-Indikatoren
- Daten und Tabellen

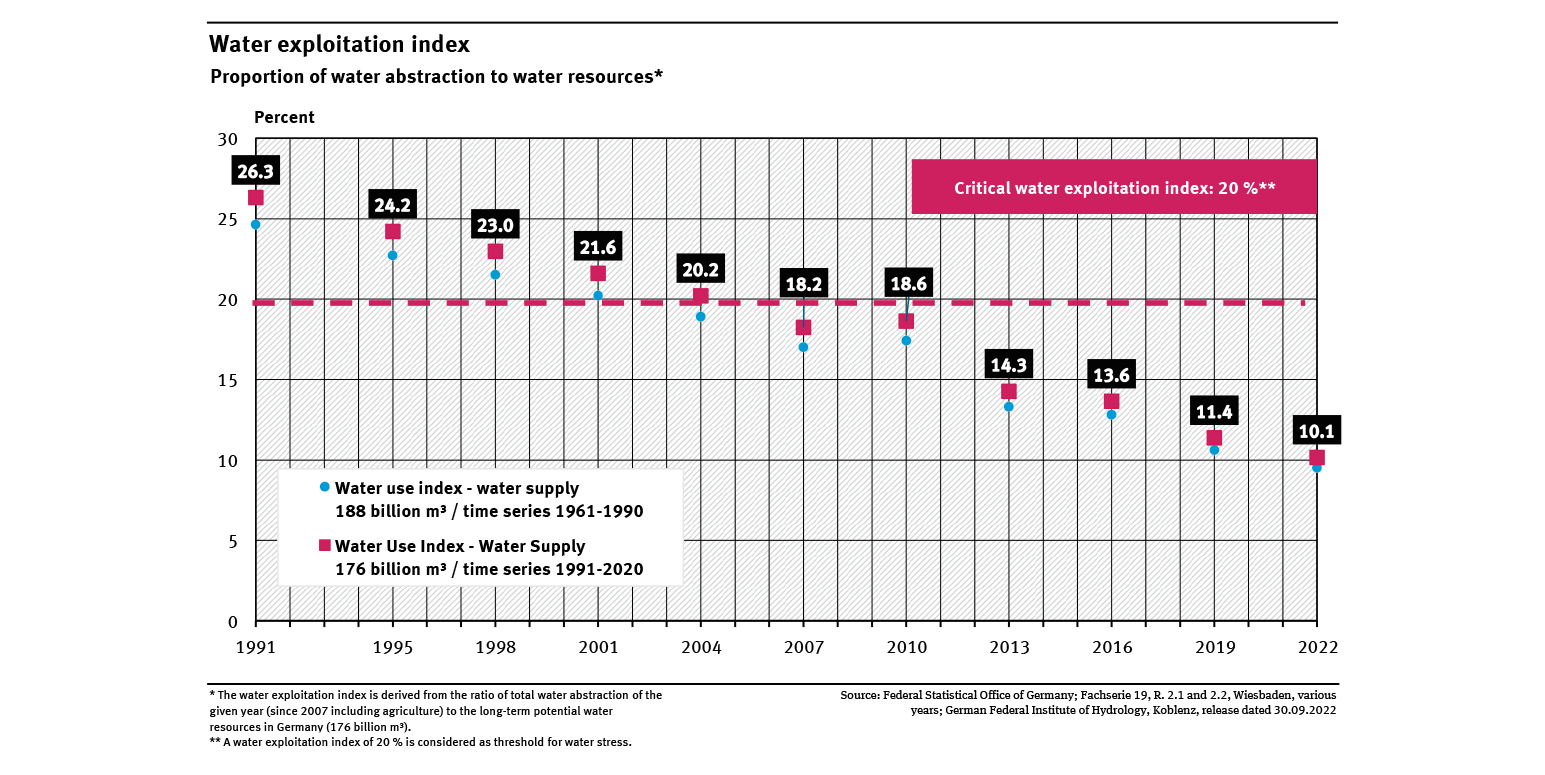
Water exploitation index
- Wasser
- Diagramme
- Umwelt-Indikatoren
- Daten und Tabellen

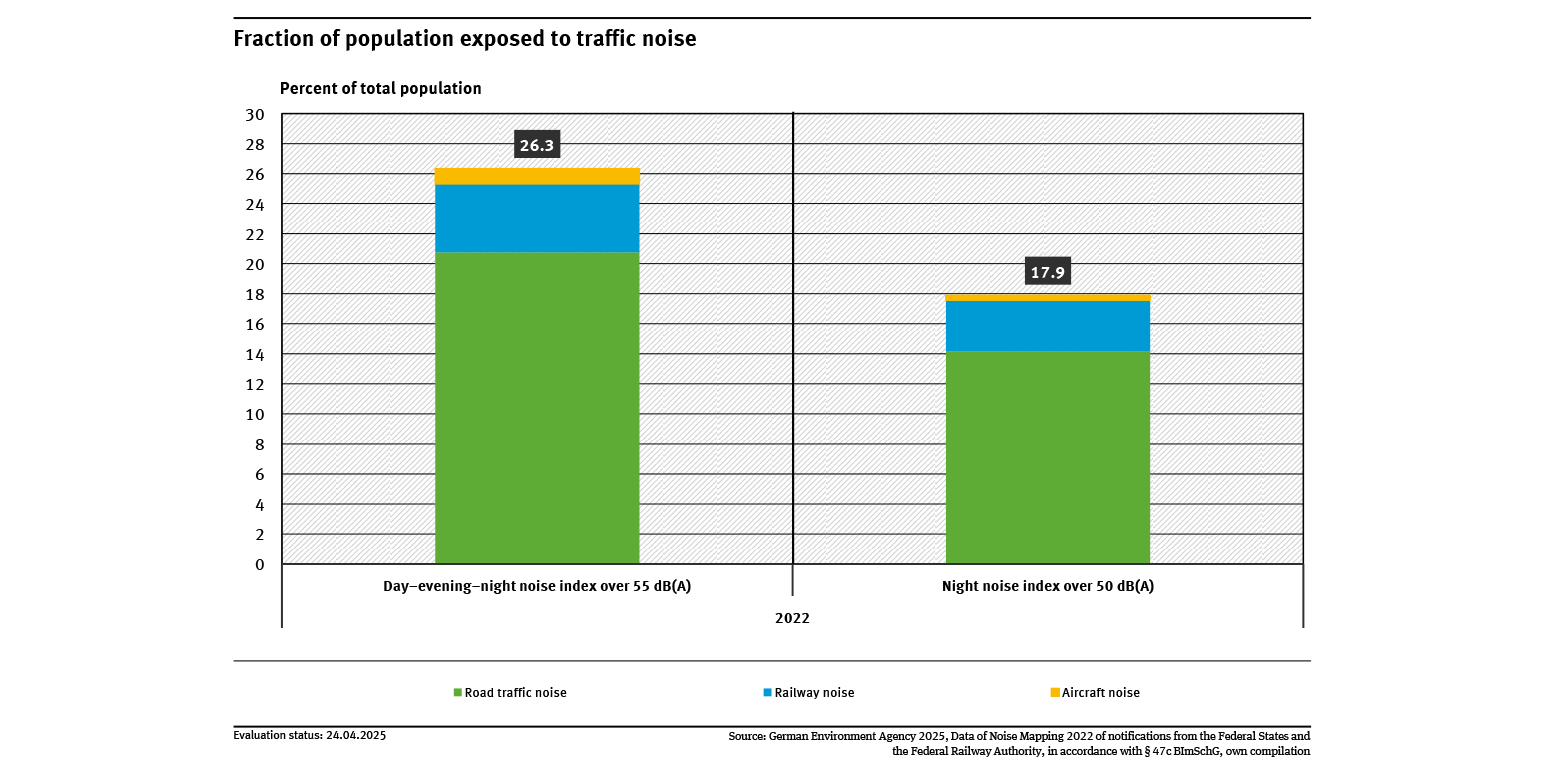
Fraction of population exposed to traffic noise
- Umwelt und Gesundheit
- Verkehr
- Diagramme
- Umwelt-Indikatoren
- Daten und Tabellen

Final energy consumption
- Energie
- Diagramme
- Umwelt-Indikatoren
- Daten und Tabellen

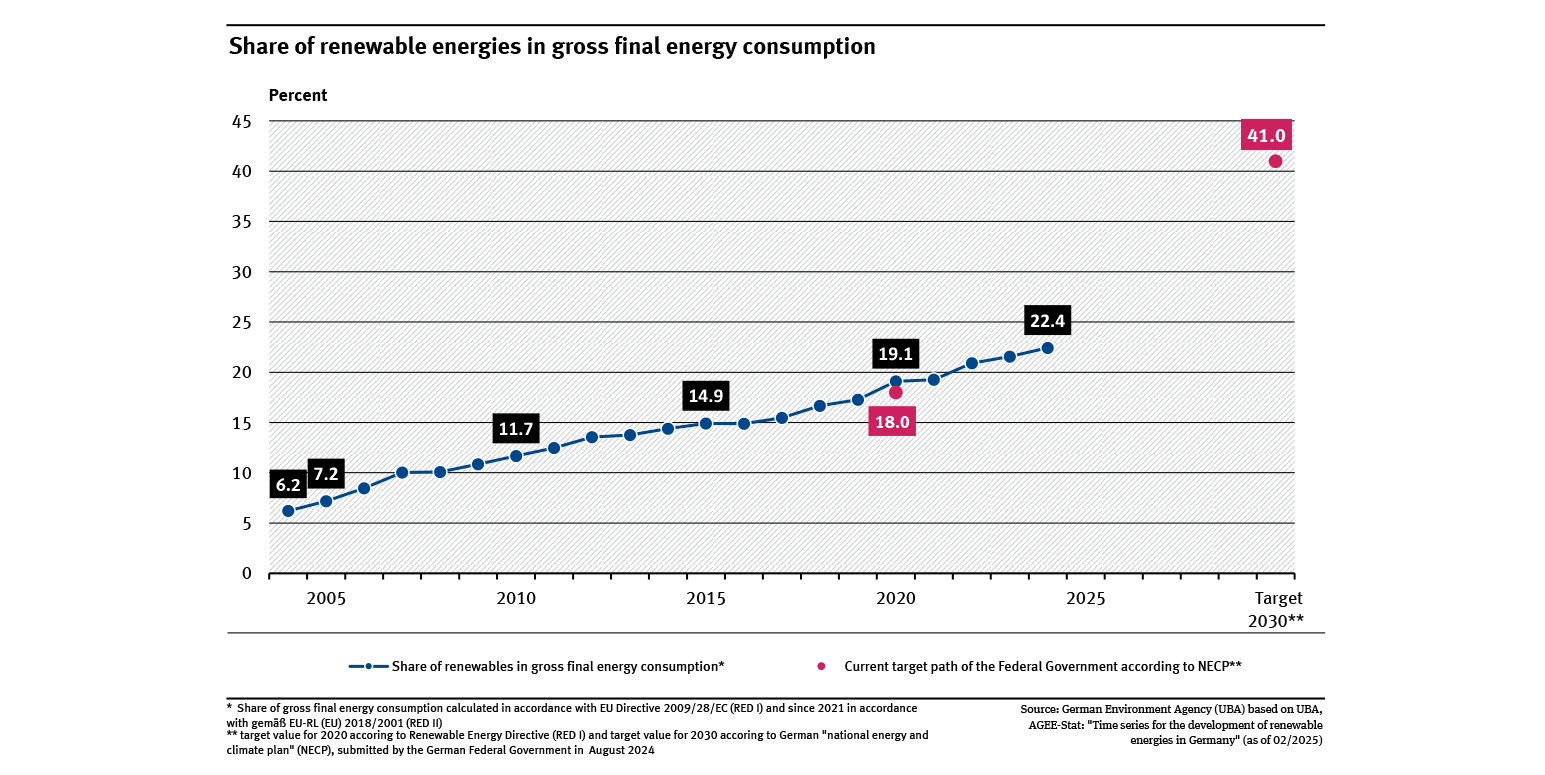
Share of renewable energies in gross final energy consumption
- Energie
- Diagramme
- Umwelt-Indikatoren
- Daten und Tabellen

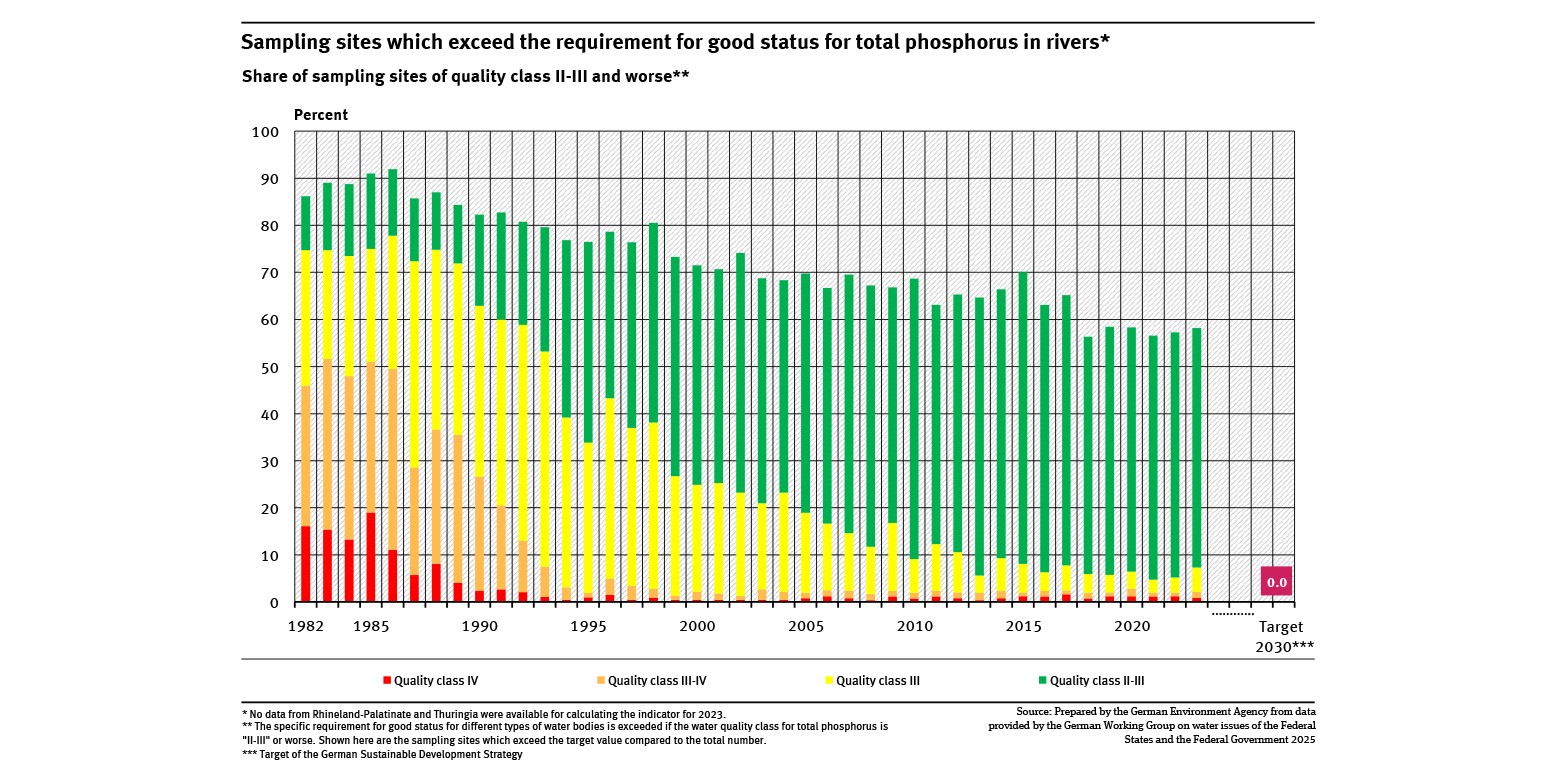
Sampling sites which exceed the requirement for good status for total phosphorus in rivers
- Wasser
- Diagramme
- Umwelt-Indikatoren
- Daten und Tabellen