Data Search

Time series for the development of renewable energy sources based on statistical data from the Working Group on Renewable Energy-Statistics (AGEE-Stat) in Germany (XLSX-file)
- Klima
- Energie
- Diagramme
- Infografiken
- Daten und Tabellen
Export data
Time series for the development of renewable energy sources based on statistical data from the Working Group on Renewable Energy-Statistics (AGEE-Stat) in Germany (PDF-file)
- Diagramme
- Infografiken
- Daten und Tabellen
Export data

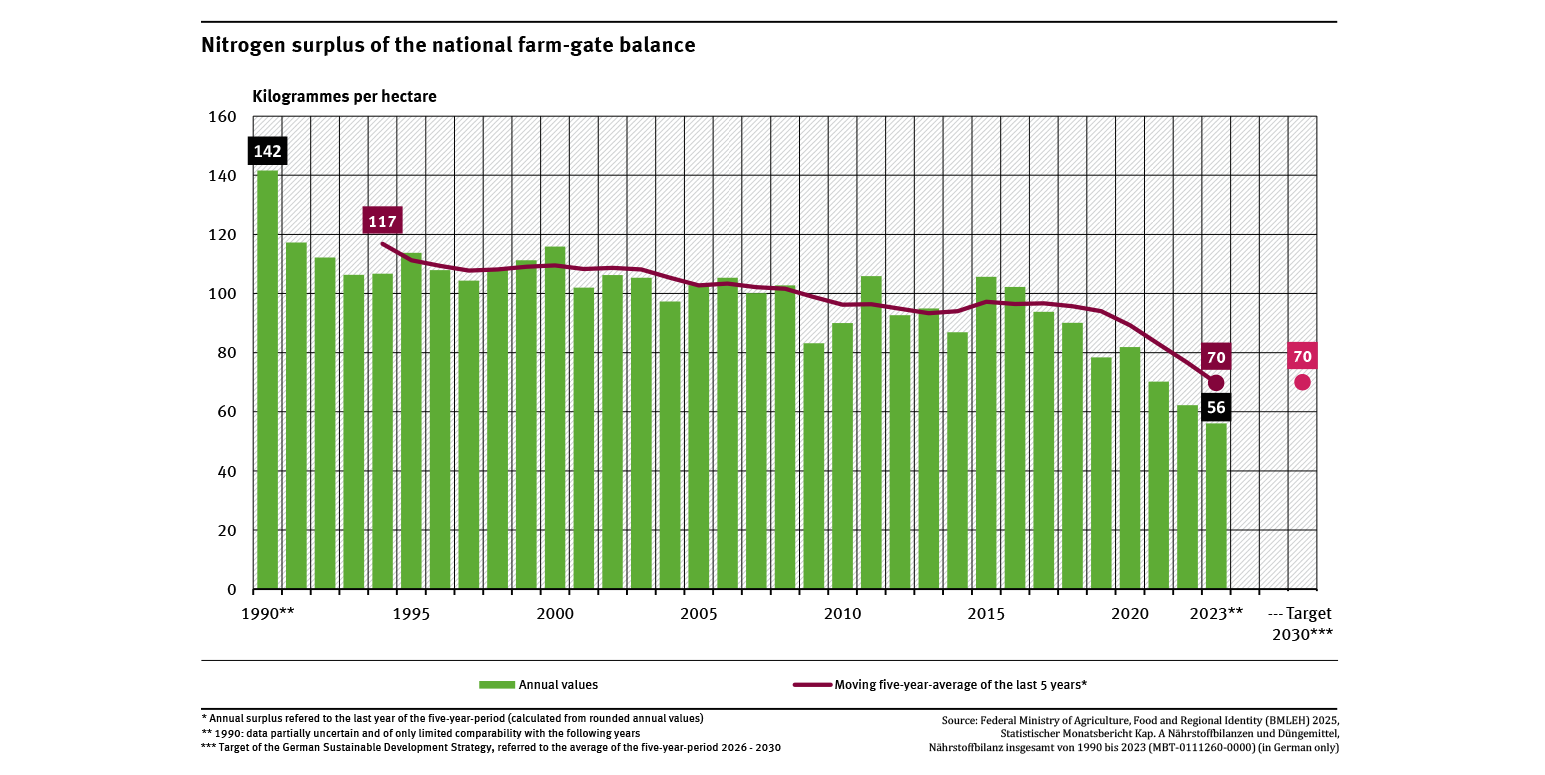
Nitrogen surplus of the national farm-gate balance
- Fläche, Boden, Land-Ökosysteme
- Land- und Forstwirtschaft
- Diagramme
- Umwelt-Indikatoren
- Daten und Tabellen

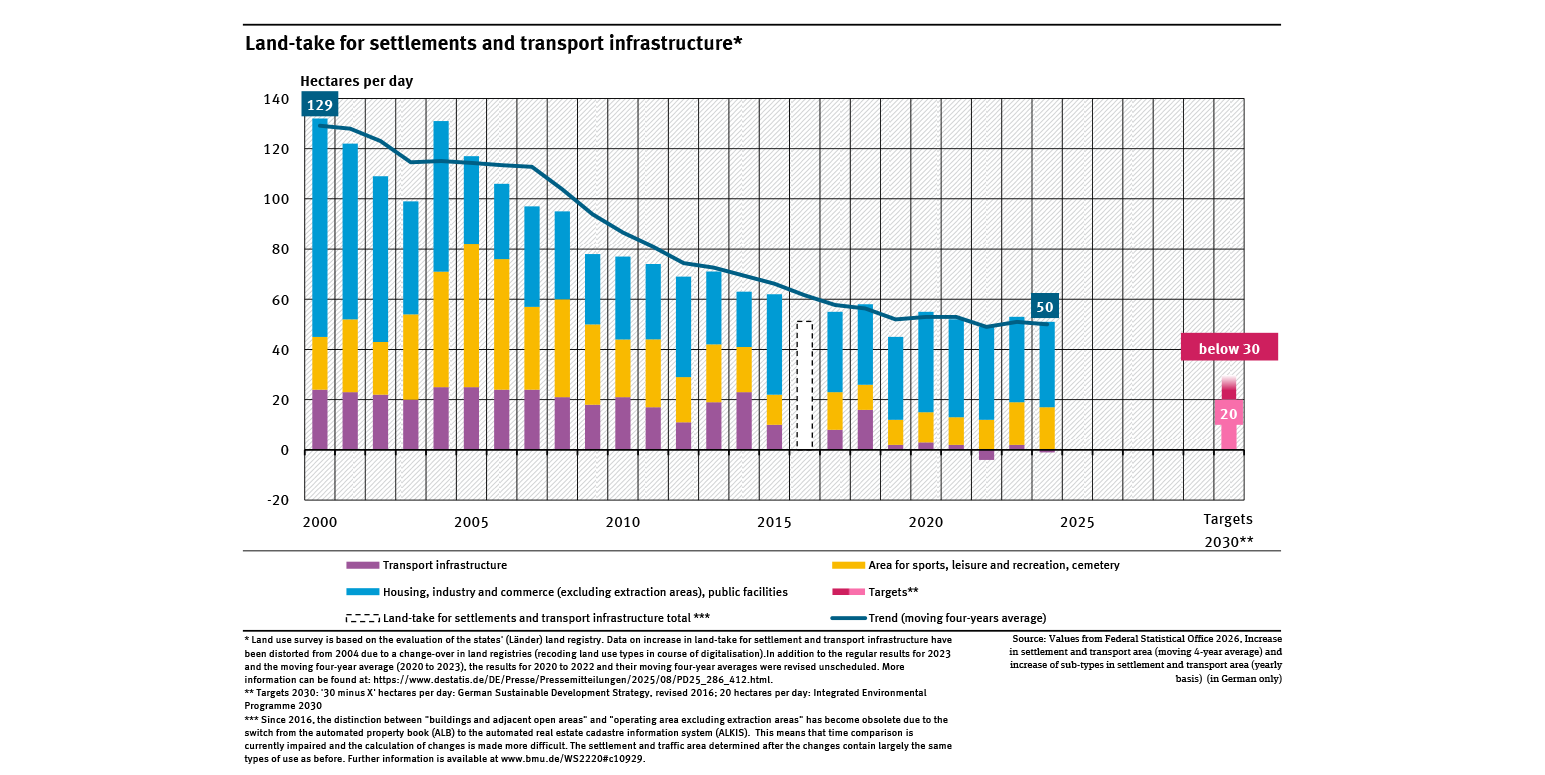
Land-take for settlements and transport infrastructure
- Fläche, Boden, Land-Ökosysteme
- Diagramme
- Umwelt-Indikatoren
- Daten und Tabellen

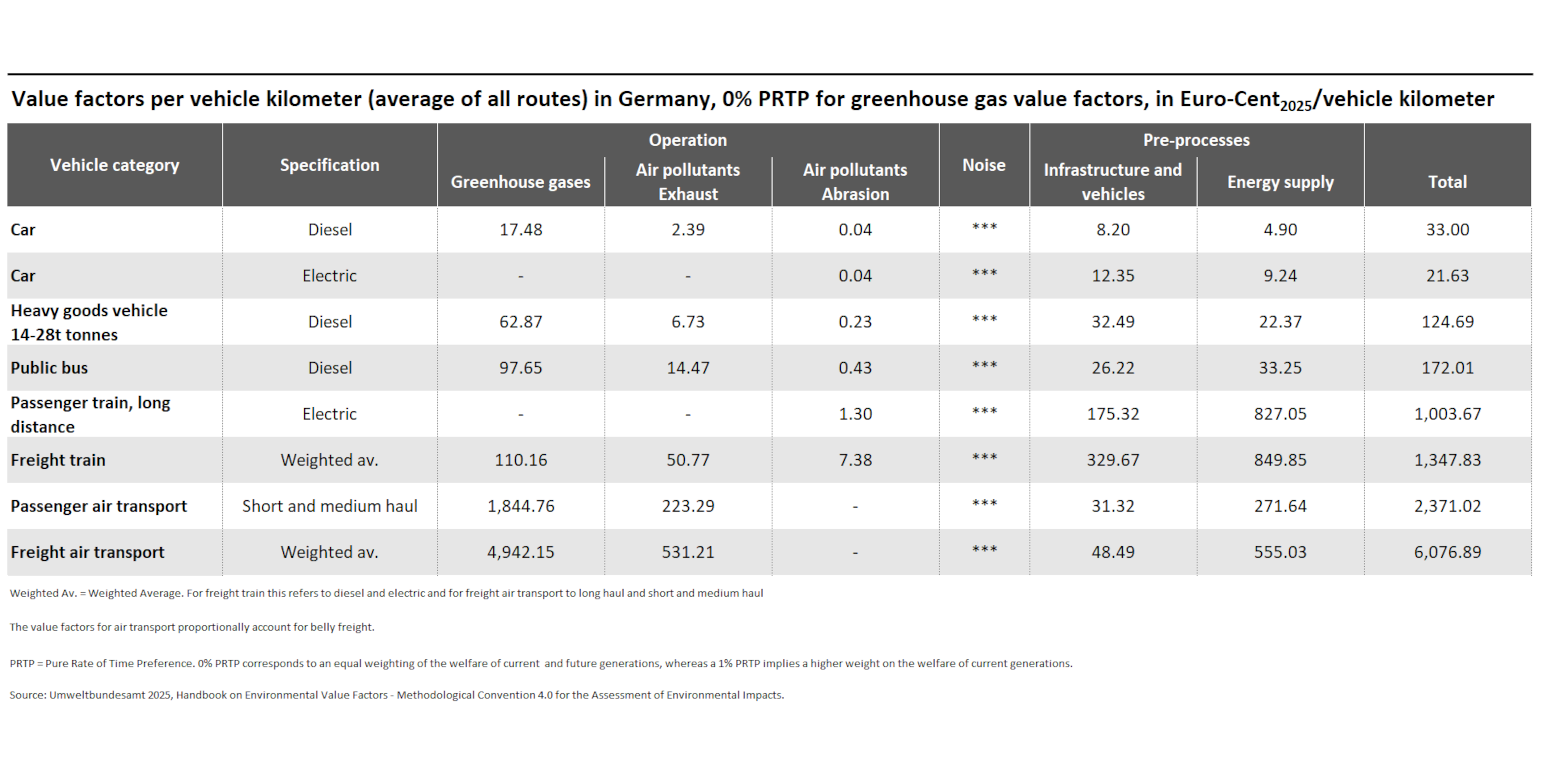
Value factors per vehicle kilometer for selected modes of transport
- Verkehr
- Daten und Tabellen

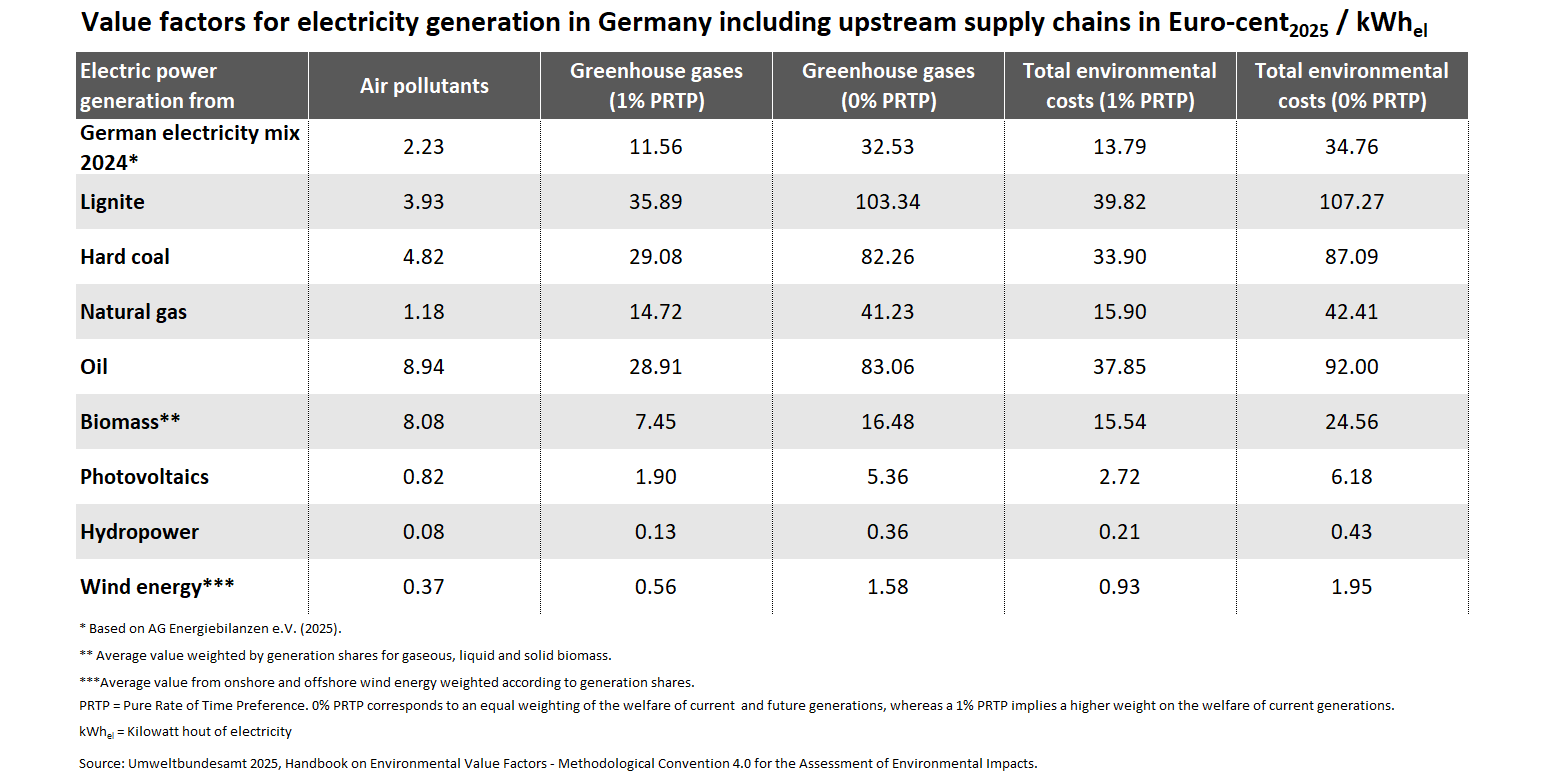
Value factors for greenhouse gas & air pollution related environmental impacts from power generation
- Klima
- Luft
- Daten und Tabellen

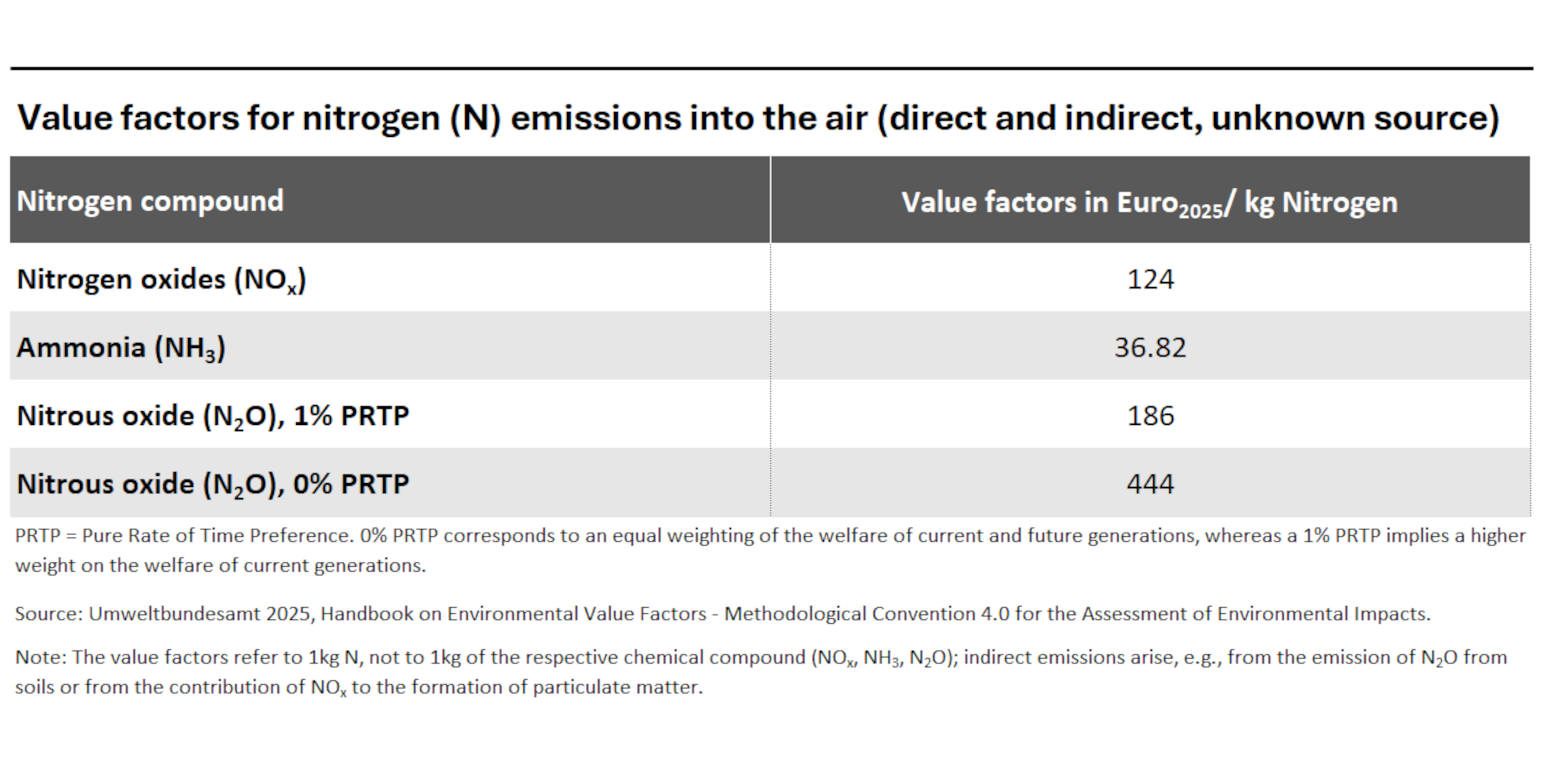
The emission of nitrogen compounds leads to substantial environmental damage.
- Luft
- Land- und Forstwirtschaft
- Daten und Tabellen

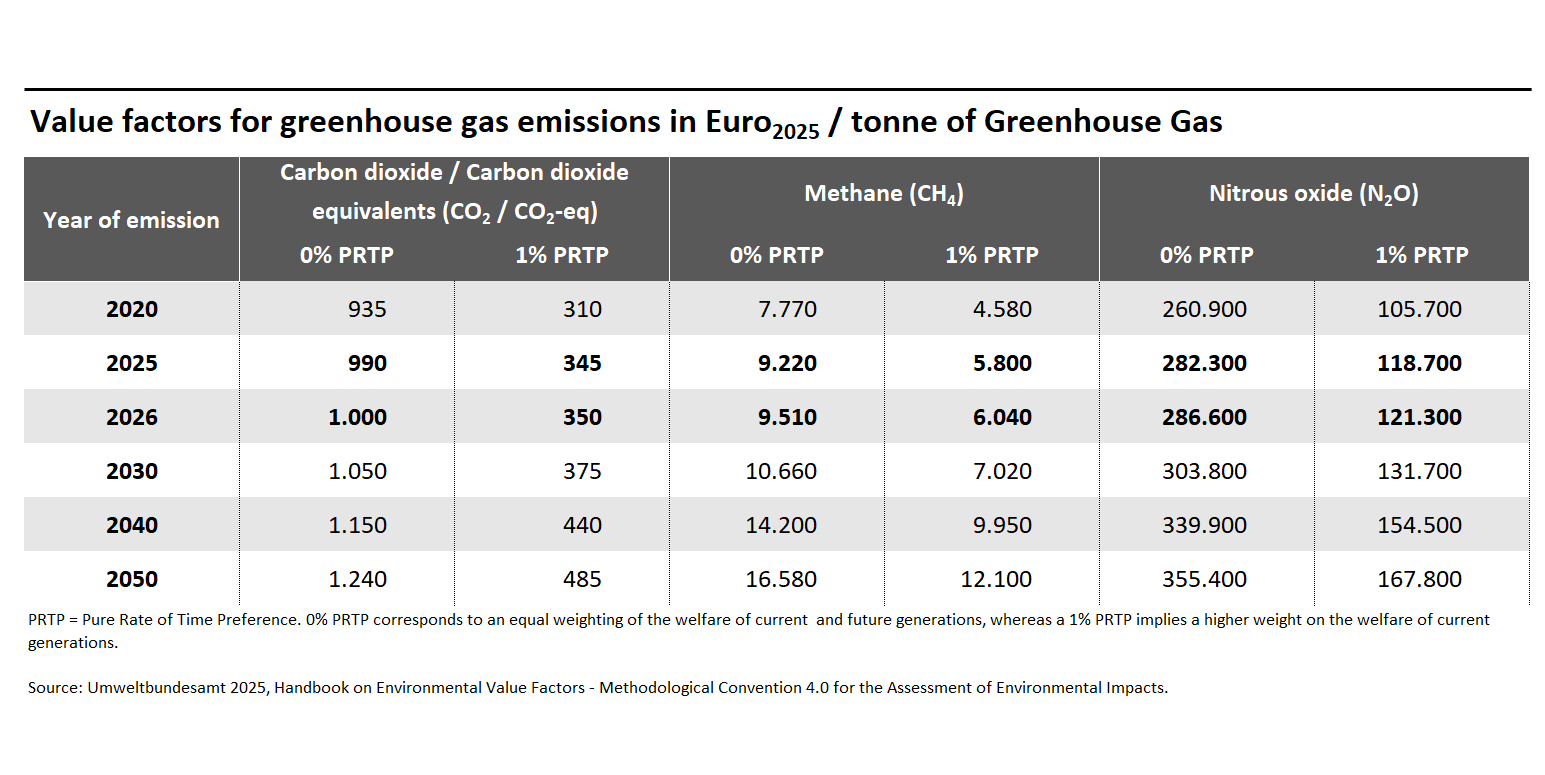
The emission of greenhouse gases leads to significant economic and societal damages.
- Klima
- Daten und Tabellen

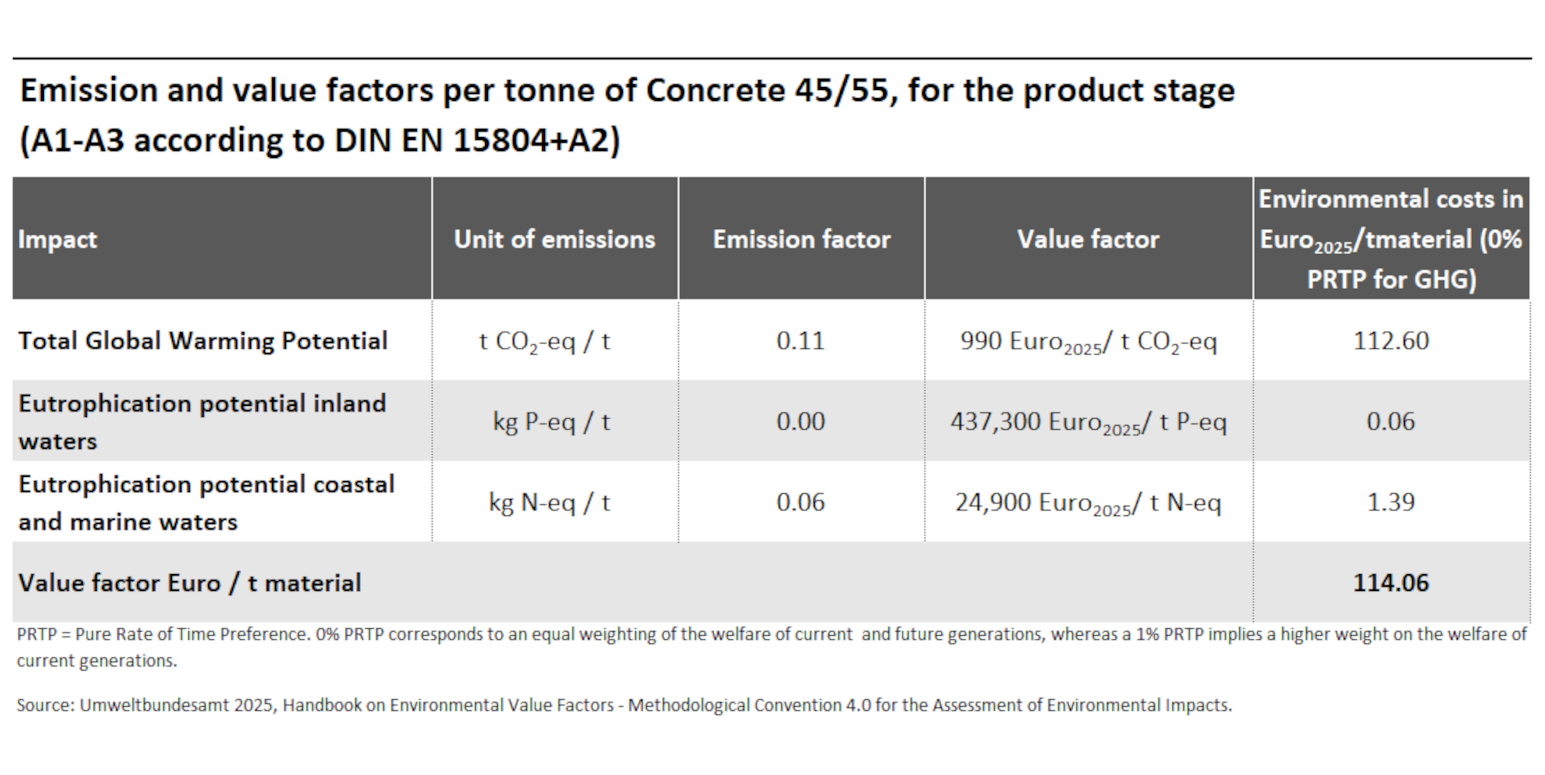
Environmental impacts of concrete 45/55
- Ressourcen und Abfall
- Daten und Tabellen

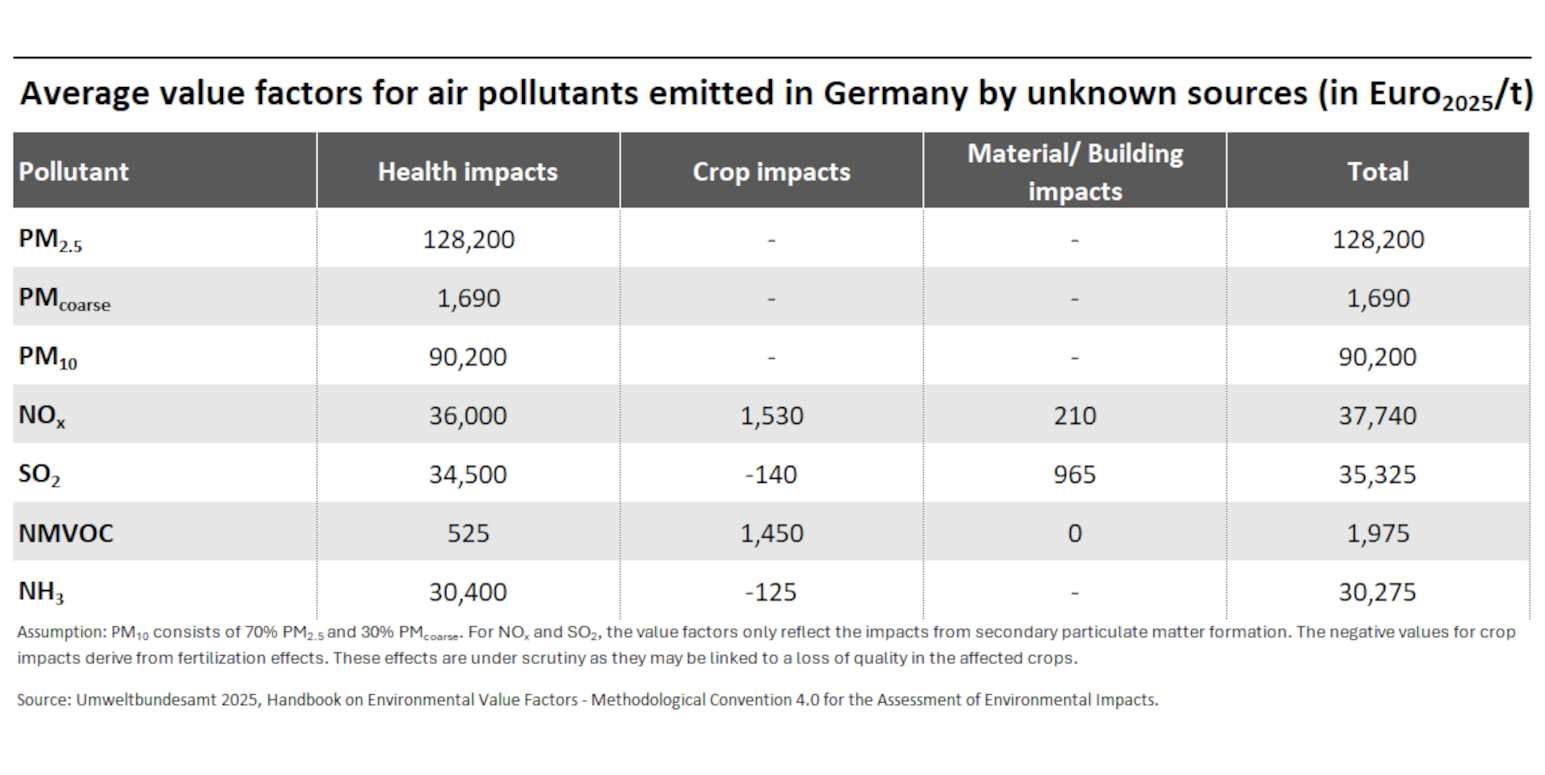
Air pollutants do not only affect human health but also impact crops and buildings.
- Luft
- Daten und Tabellen