Skip to main content Skip to main menu Skip to footer

Data Search

Data Search

Here you will find diagrams, infographics, maps and tables for direct download.

Data Search

A graph shows the share of renewable energies in gross final energy consumption and gross electricity consumption. The share in gross electricity consumption rose from 6.3 percent in 2000 to 46.2 percent in 2022. The share in gross final energy consumption rose from 6.2 to 20.4 percent between 2004 and 2022.

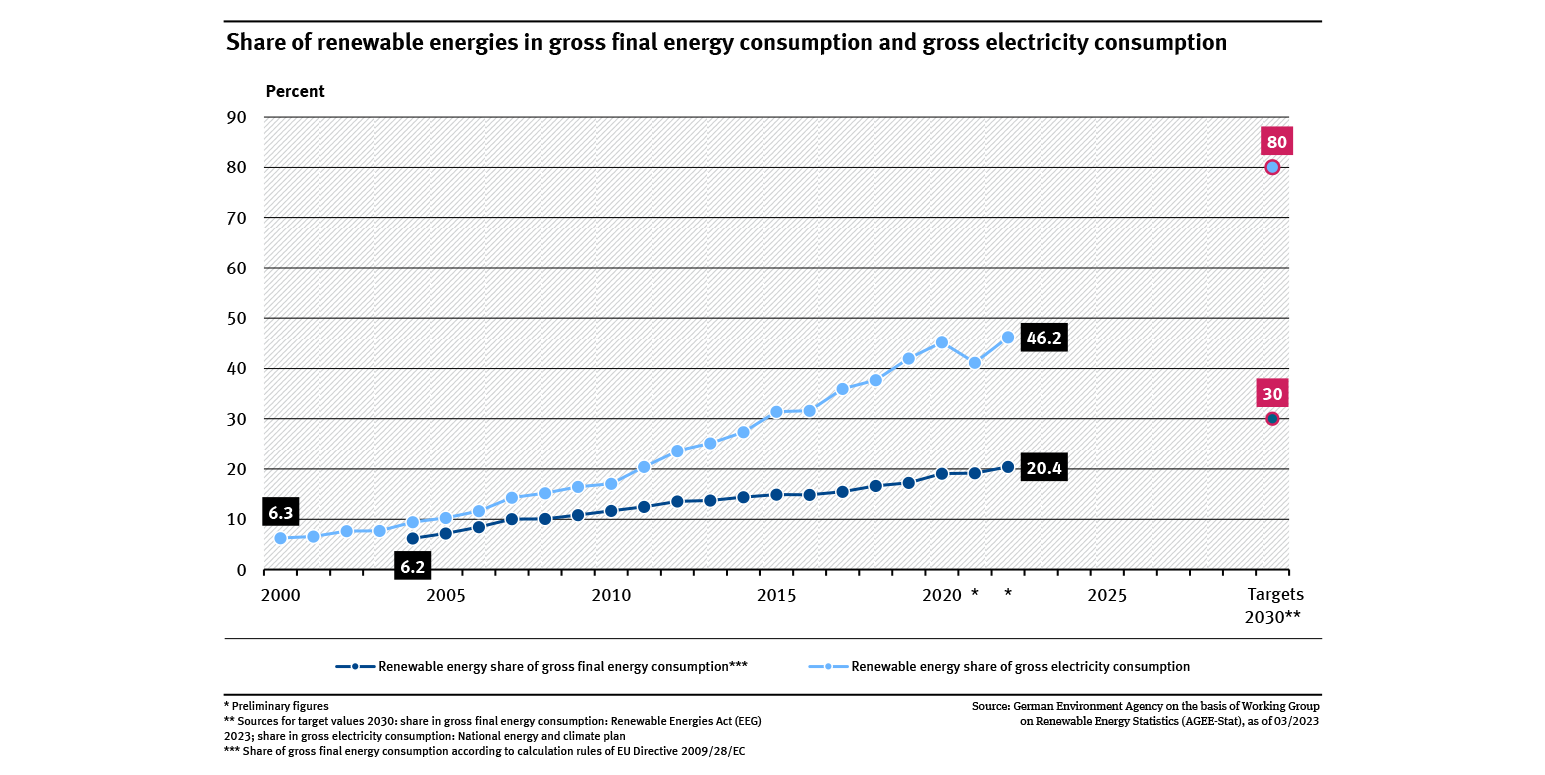
Renewable energy share in gross final energy consumption and gross electricity consumption

  • Energie
  • Diagramme
  • Umwelt-Indikatoren
  • Daten und Tabellen
Export data
A diagram shows the distribution of the ecological status/ecological potential of transitional and coastal waters for the North Sea and the Baltic Sea for the years 2010, 2015 and 2021. The target for 2027 is shown (100 % good or very good).

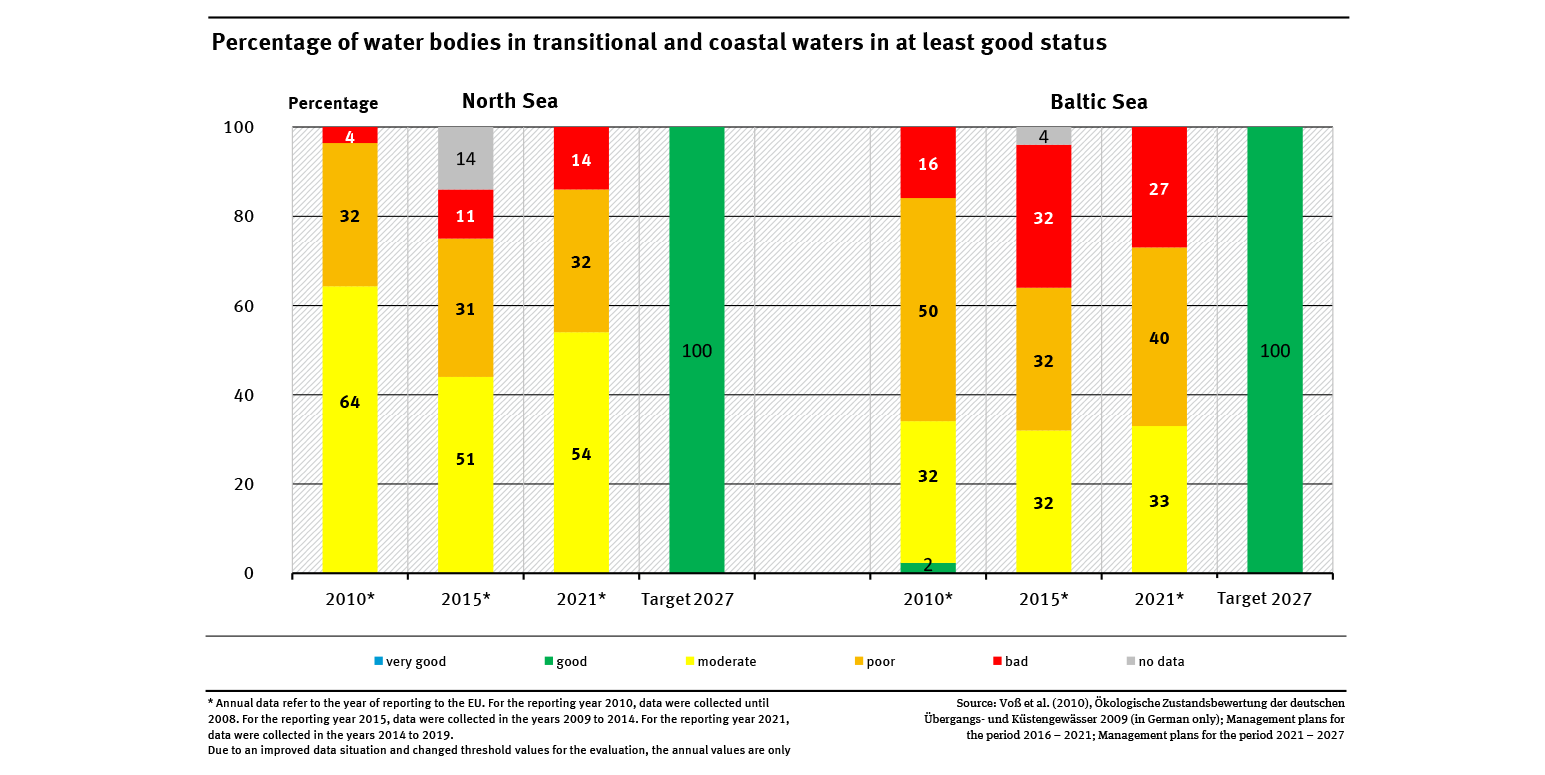
Percentage of water bodies in transitional and coastal waters in at least good status

  • Wasser
  • Diagramme
  • Umwelt-Indikatoren
  • Daten und Tabellen
Export data
A graph shows the distribution of the environmental status and potential of the lakes for the years 2015 and 2021. The target for 2027 is also shown (100 percent ‘good’ or ‘very good’). In 2021, 24.7 percent showed at least a good status or good potential.

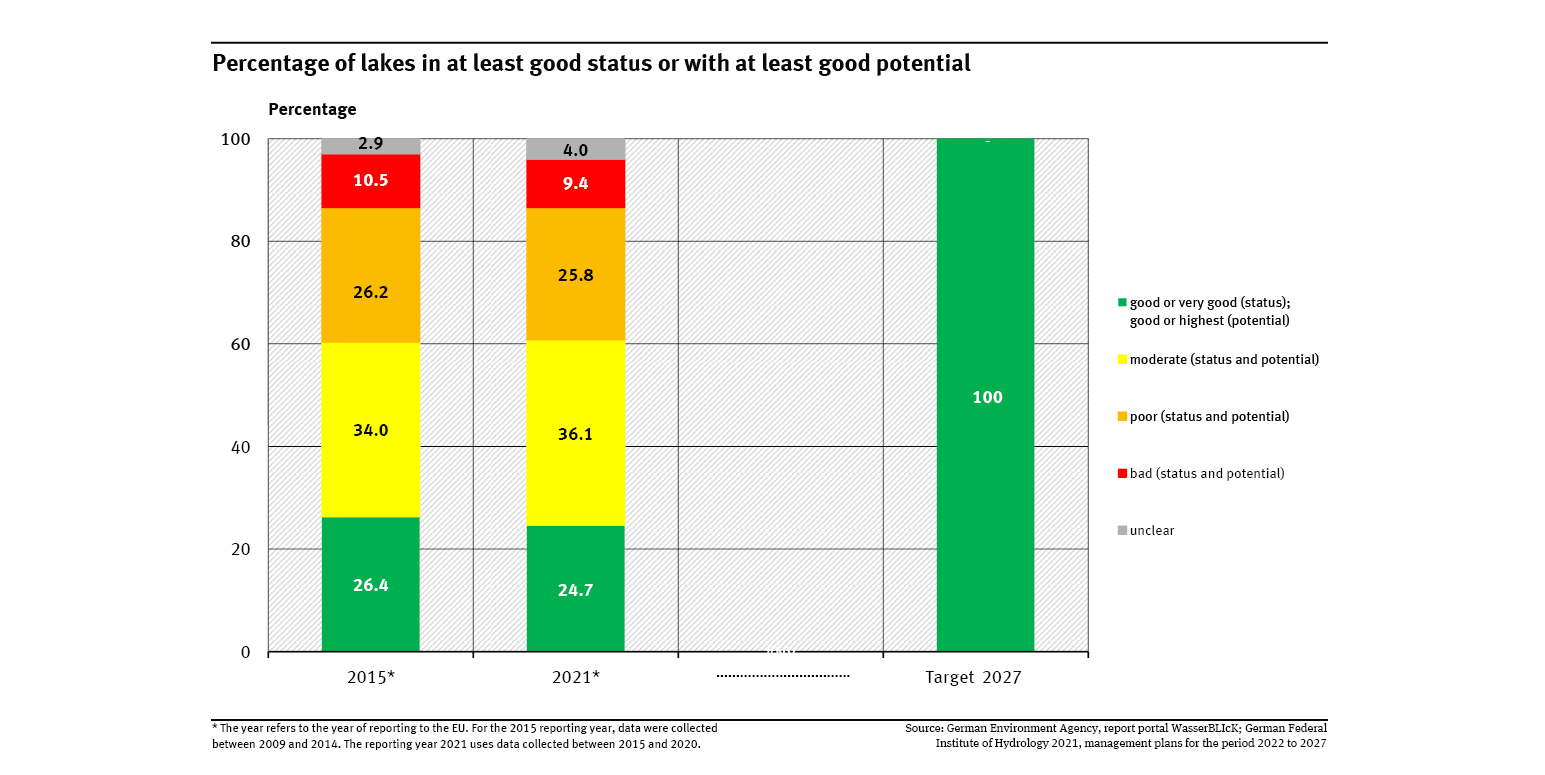
Percentage of lakes in at least good status or with at least a good potential

  • Wasser
  • Diagramme
  • Umwelt-Indikatoren
  • Daten und Tabellen
Export data
A graph shows the distribution of the environmental status and potential of the rivers for the years 2015 and 2021. The target for 2027 is also shown (100 percent ‘good’ or ‘very good’). In 2021, 8 percent showed at least a good status or good potential.

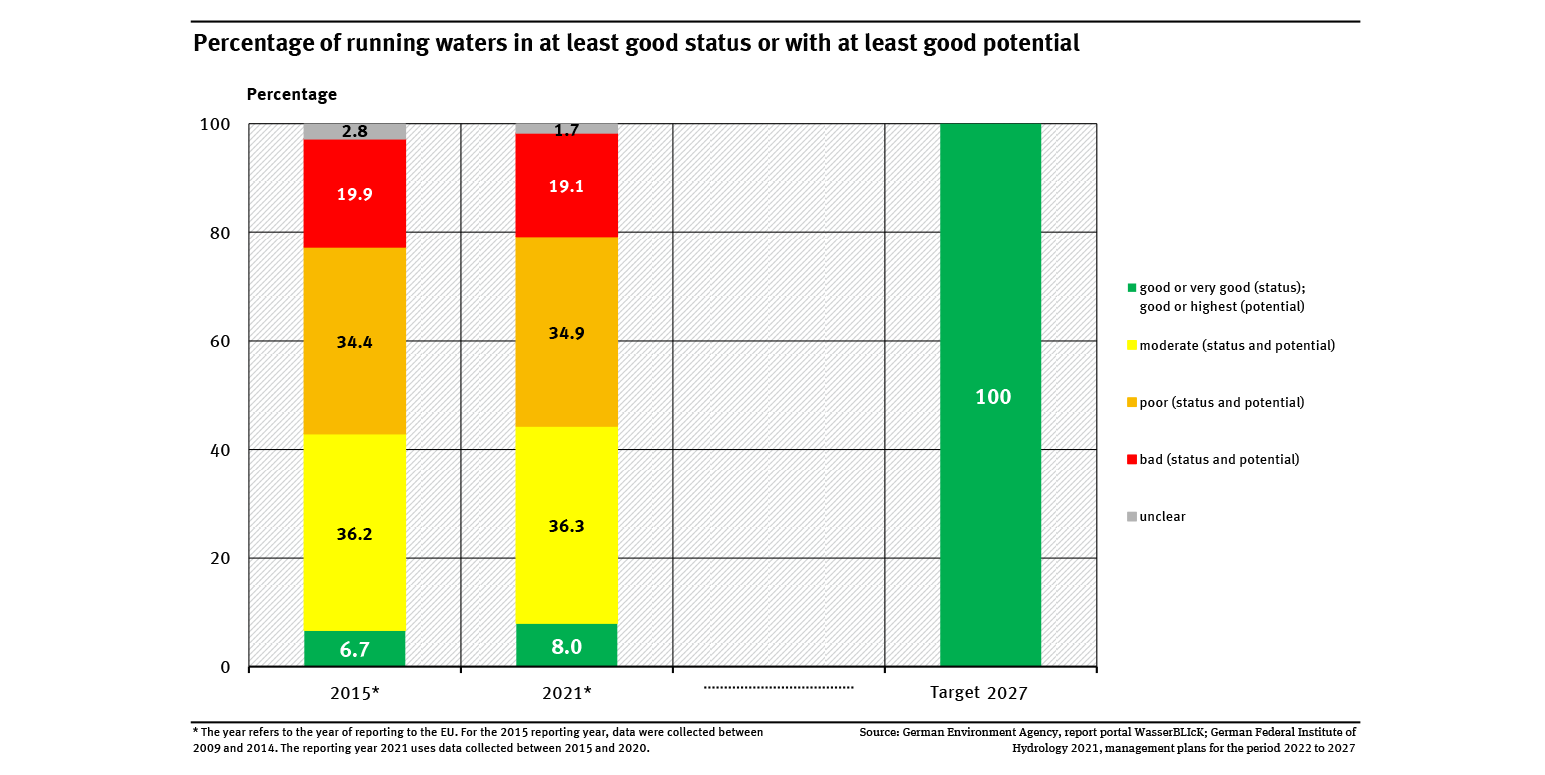
Percentage of running waters in at least good status or with at least a good potential

  • Wasser
  • Diagramme
  • Umwelt-Indikatoren
  • Daten und Tabellen
Export data
A graph shows the proportion of the forested area made up of mixed stands (2, 3 or 4 species of trees) and that of pure stands (semi-natural and non semi-natural). The proportion of mixed stands rose from almost 55 percent to almost 58 percent.

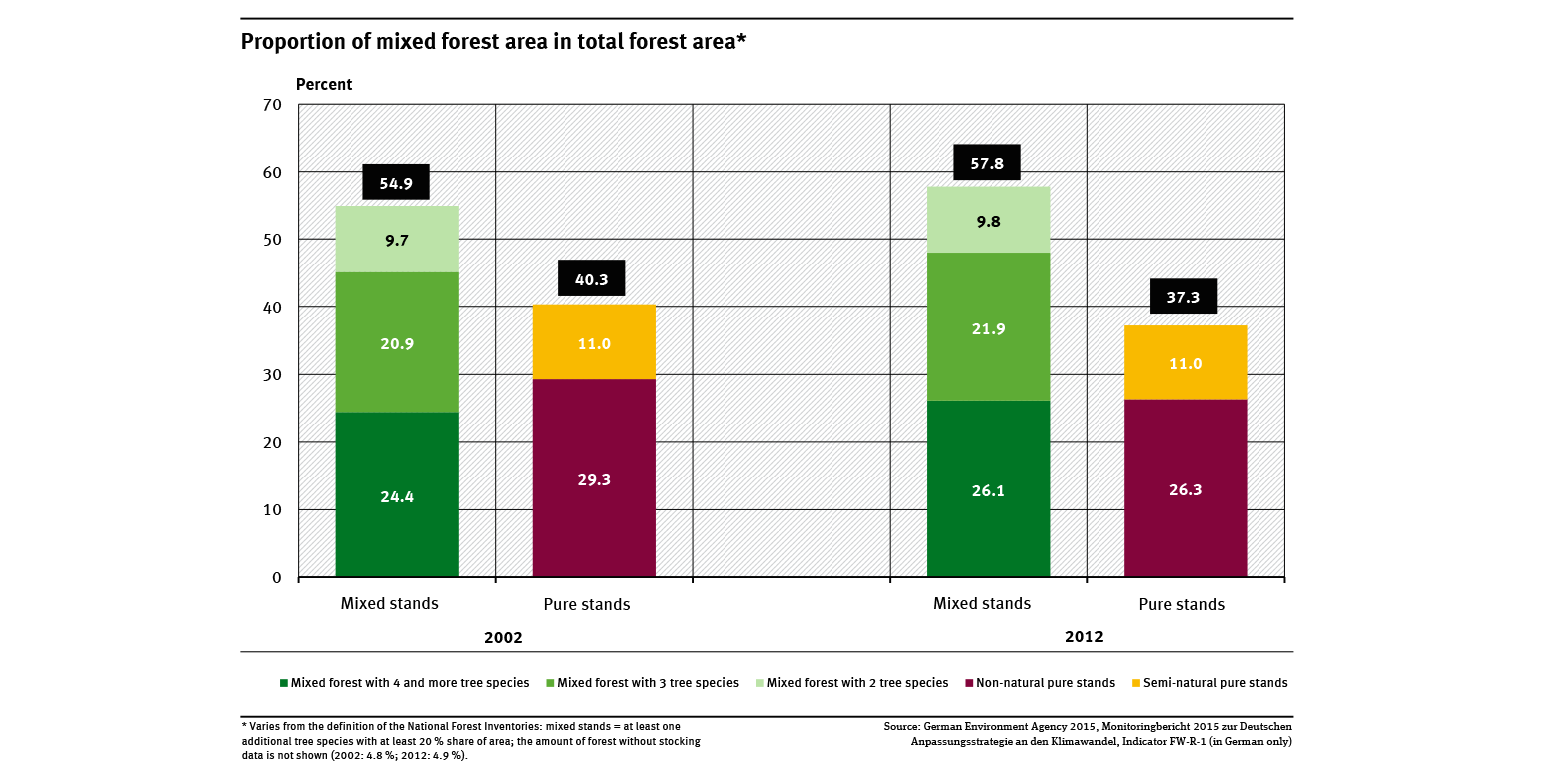
Proportion of mixed forest area in total forest area

  • Land- und Forstwirtschaft
  • Diagramme
  • Umwelt-Indikatoren
  • Daten und Tabellen
Export data
A graph shows the undissected low-traffic areas with a minimum size of 100 km² as a percentage of Germany’s total land area for 2000, 2005, 2010 and 2015 and the target value. Due to differences in methodology, the values are not directly comparable.

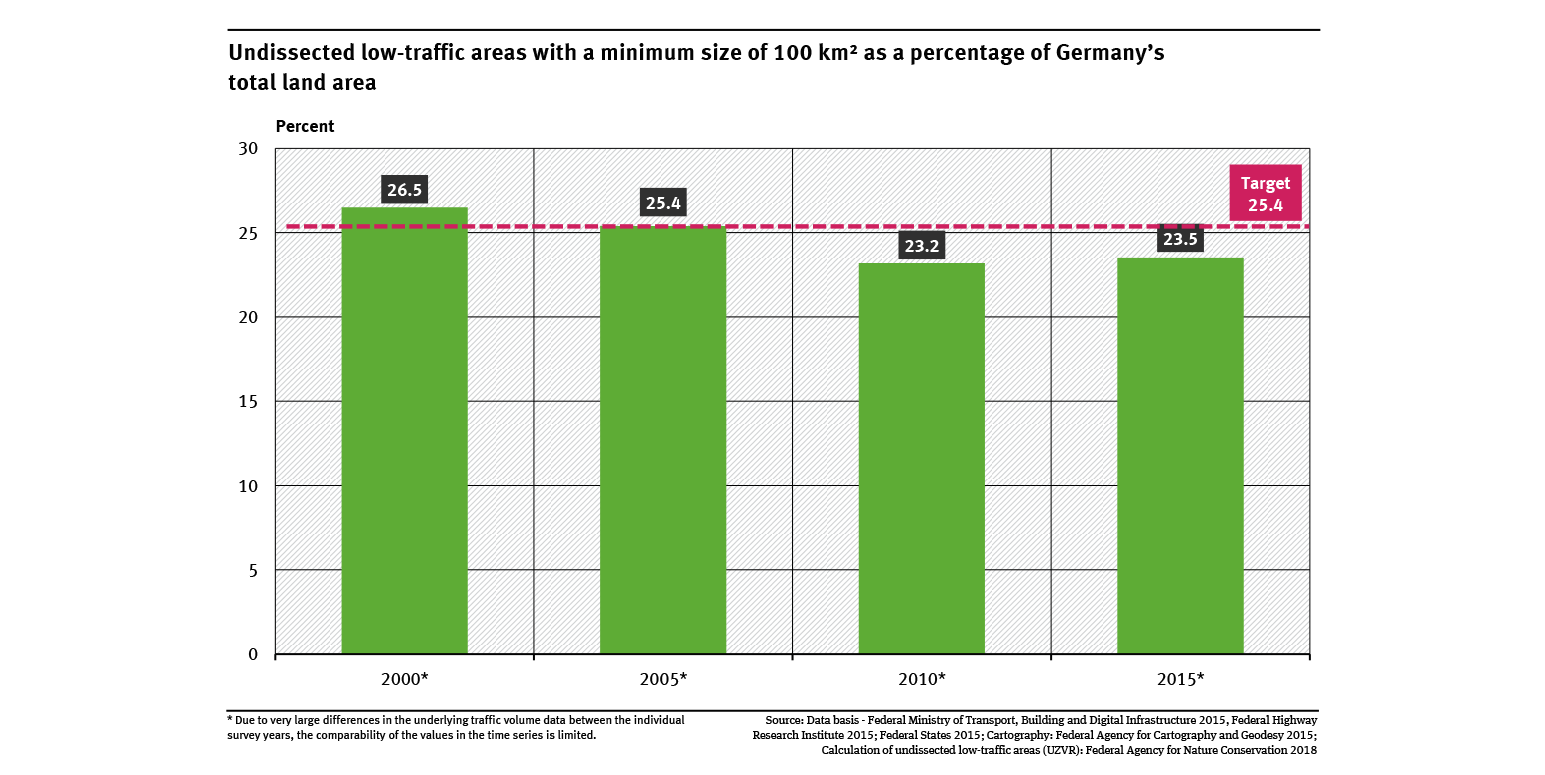
Undissected low-traffic areas with a minimum size of 100 km² as a percentage of Germany’s ...

  • Fläche, Boden, Land-Ökosysteme
  • Diagramme
  • Umwelt-Indikatoren
  • Daten und Tabellen
Export data

You can also search in other data portals of the German Environment Agency

Short link: www.umweltbundesamt.de/n300701en