Data Search

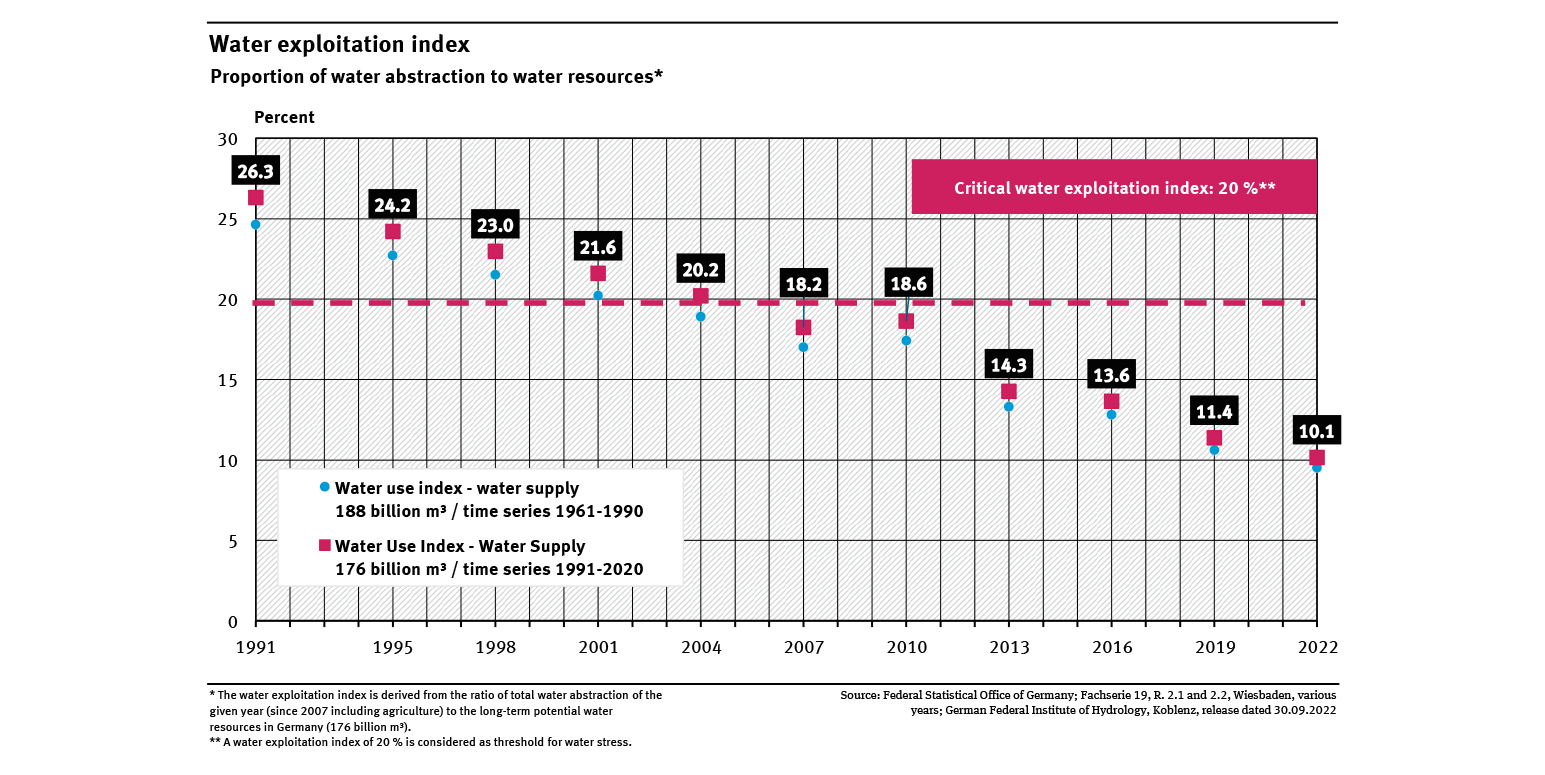
Water exploitation index
- Wasser
- Diagramme
- Umwelt-Indikatoren
- Daten und Tabellen

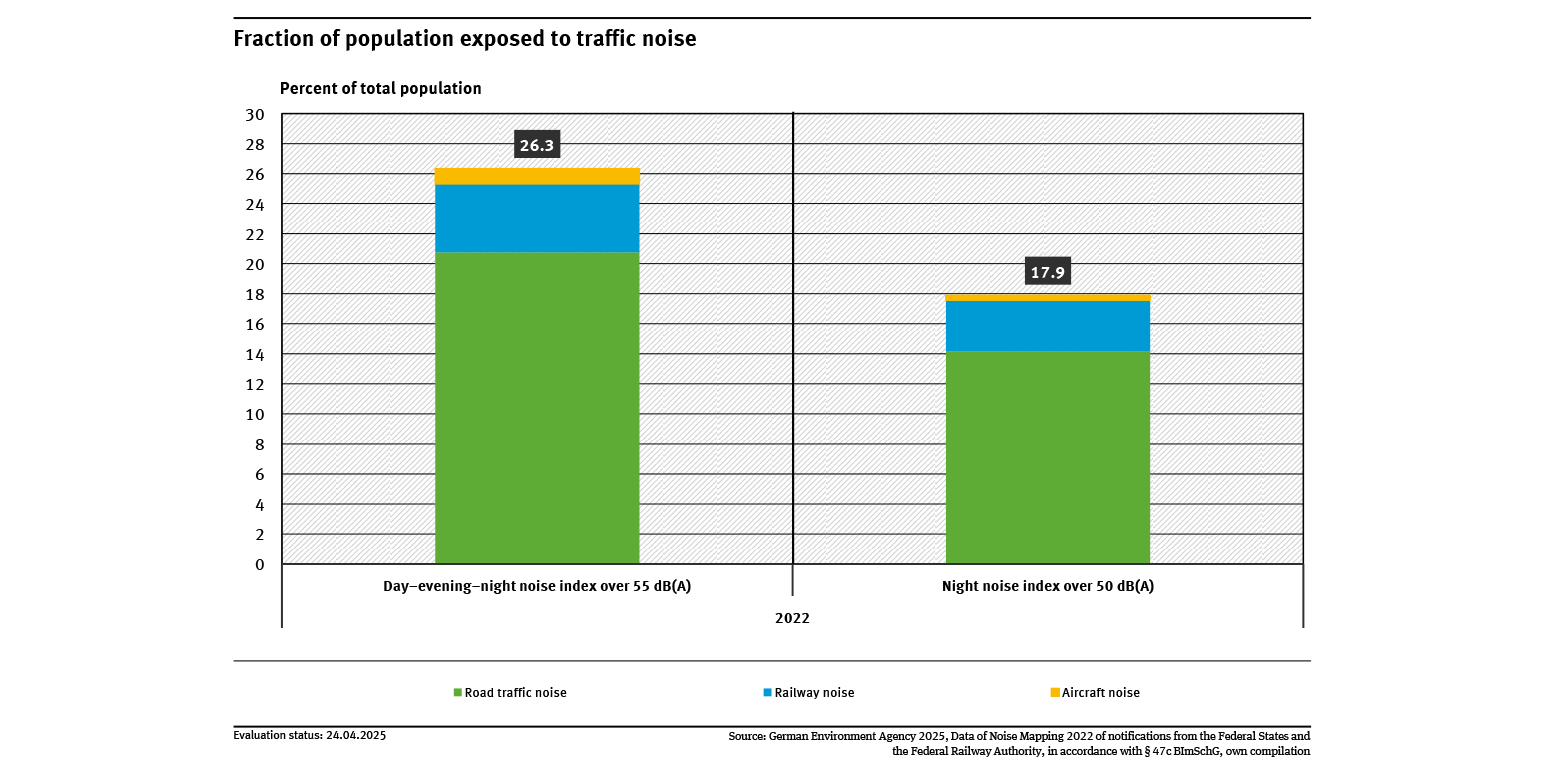
Fraction of population exposed to traffic noise
- Umwelt und Gesundheit
- Verkehr
- Diagramme
- Umwelt-Indikatoren
- Daten und Tabellen

Final energy consumption
- Energie
- Diagramme
- Umwelt-Indikatoren
- Daten und Tabellen

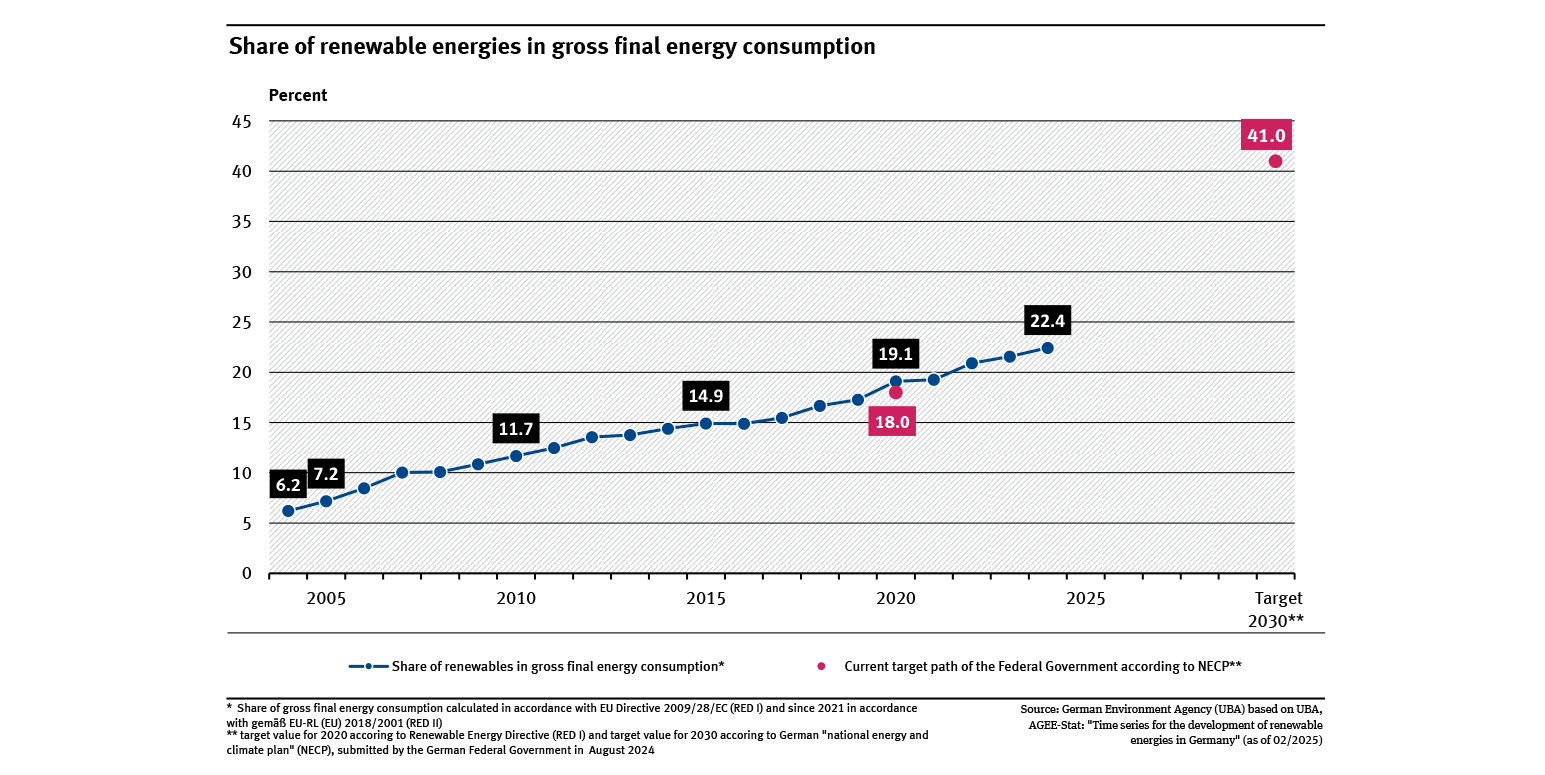
Share of renewable energies in gross final energy consumption
- Energie
- Diagramme
- Umwelt-Indikatoren
- Daten und Tabellen

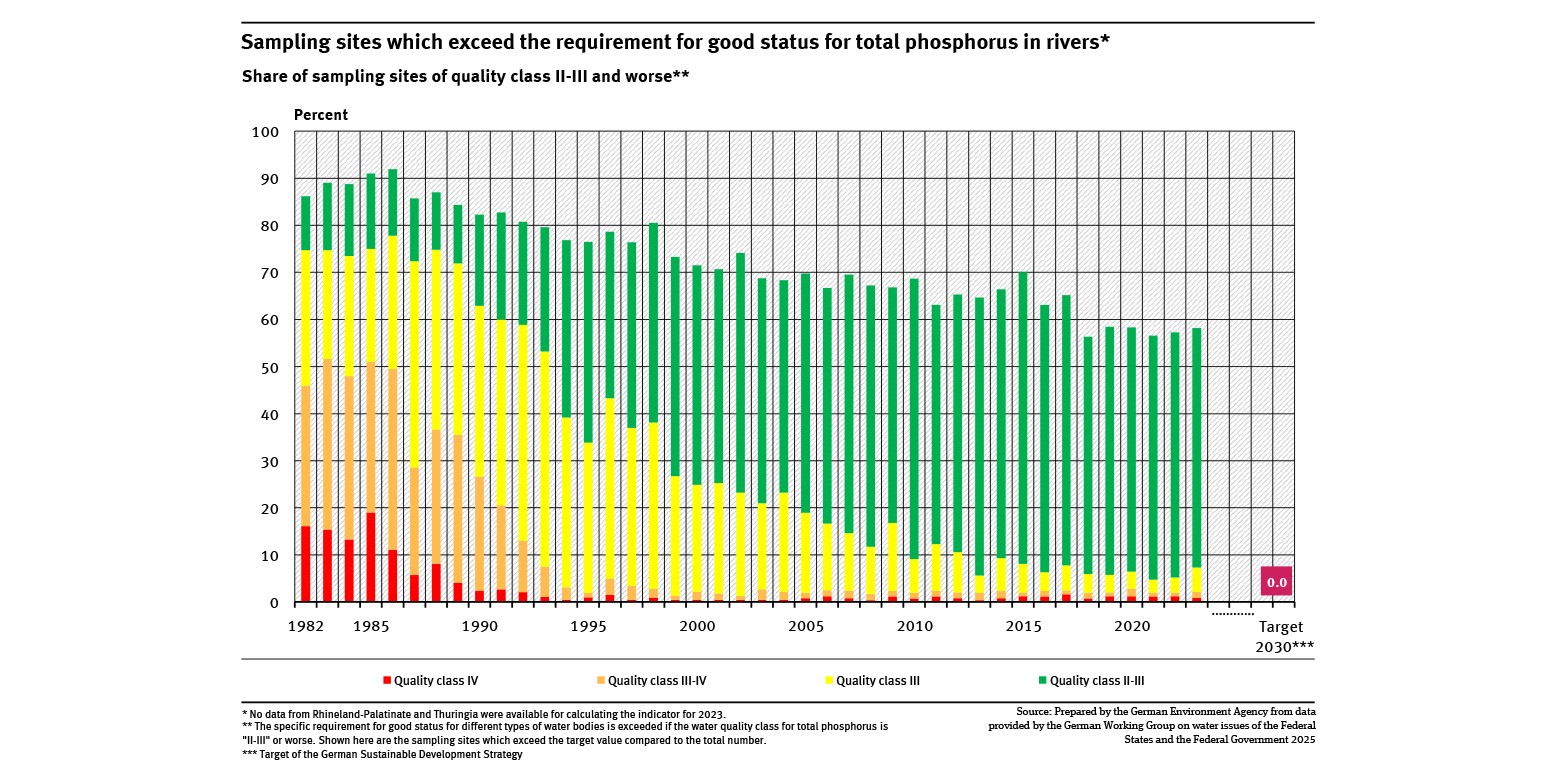
Sampling sites which exceed the requirement for good status for total phosphorus in rivers
- Wasser
- Diagramme
- Umwelt-Indikatoren
- Daten und Tabellen


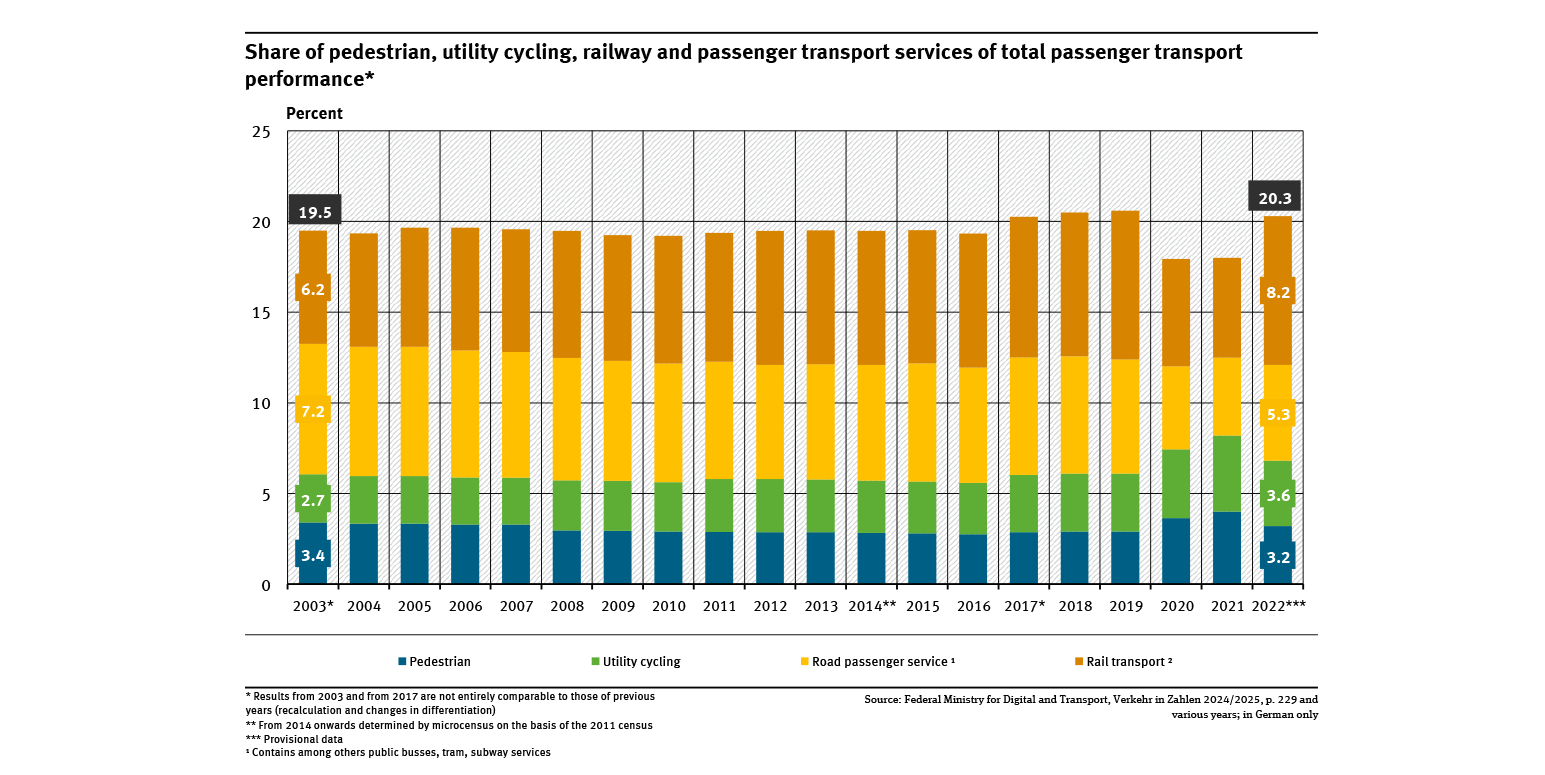
Share of pedestrian, utility cycling, railway and passenger transport services ...
- Verkehr
- Diagramme
- Umwelt-Indikatoren
- Daten und Tabellen

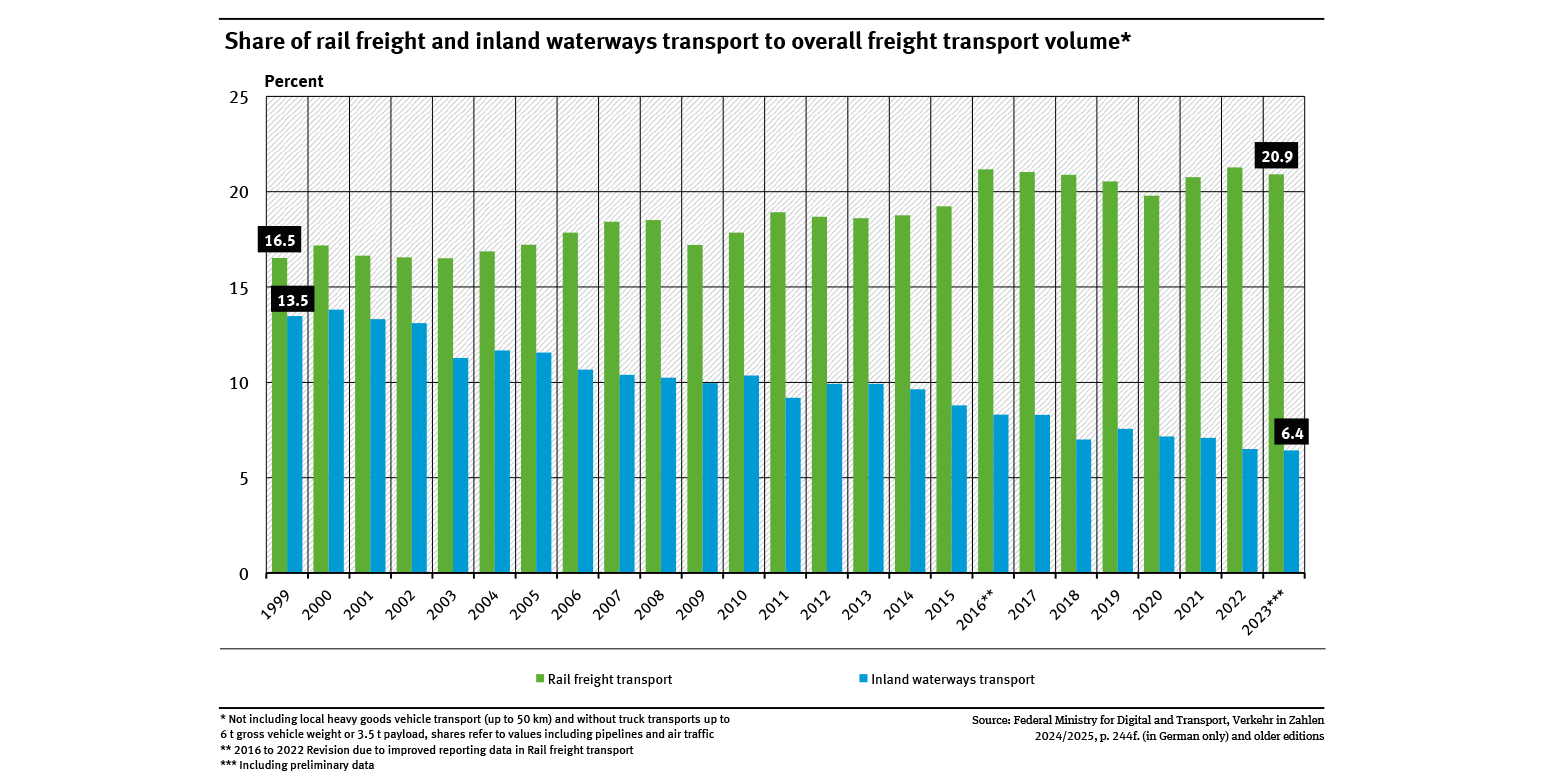
Share of rail freight and inland waterways transport to overall freight transport volume
- Verkehr
- Diagramme
- Umwelt-Indikatoren
- Daten und Tabellen

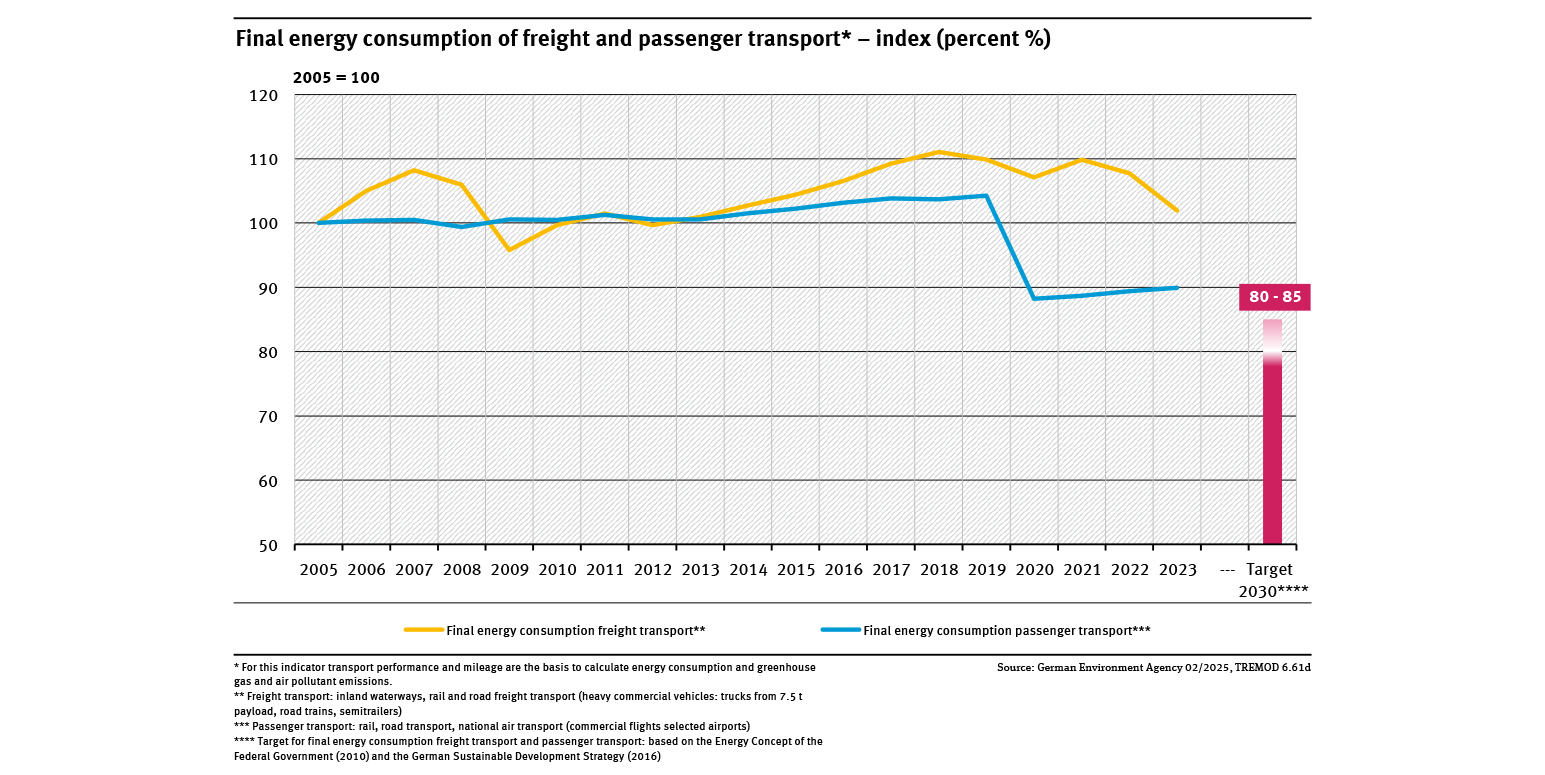
Final energy consumption of freight and passenger transport
- Energie
- Verkehr
- Diagramme
- Umwelt-Indikatoren
- Daten und Tabellen

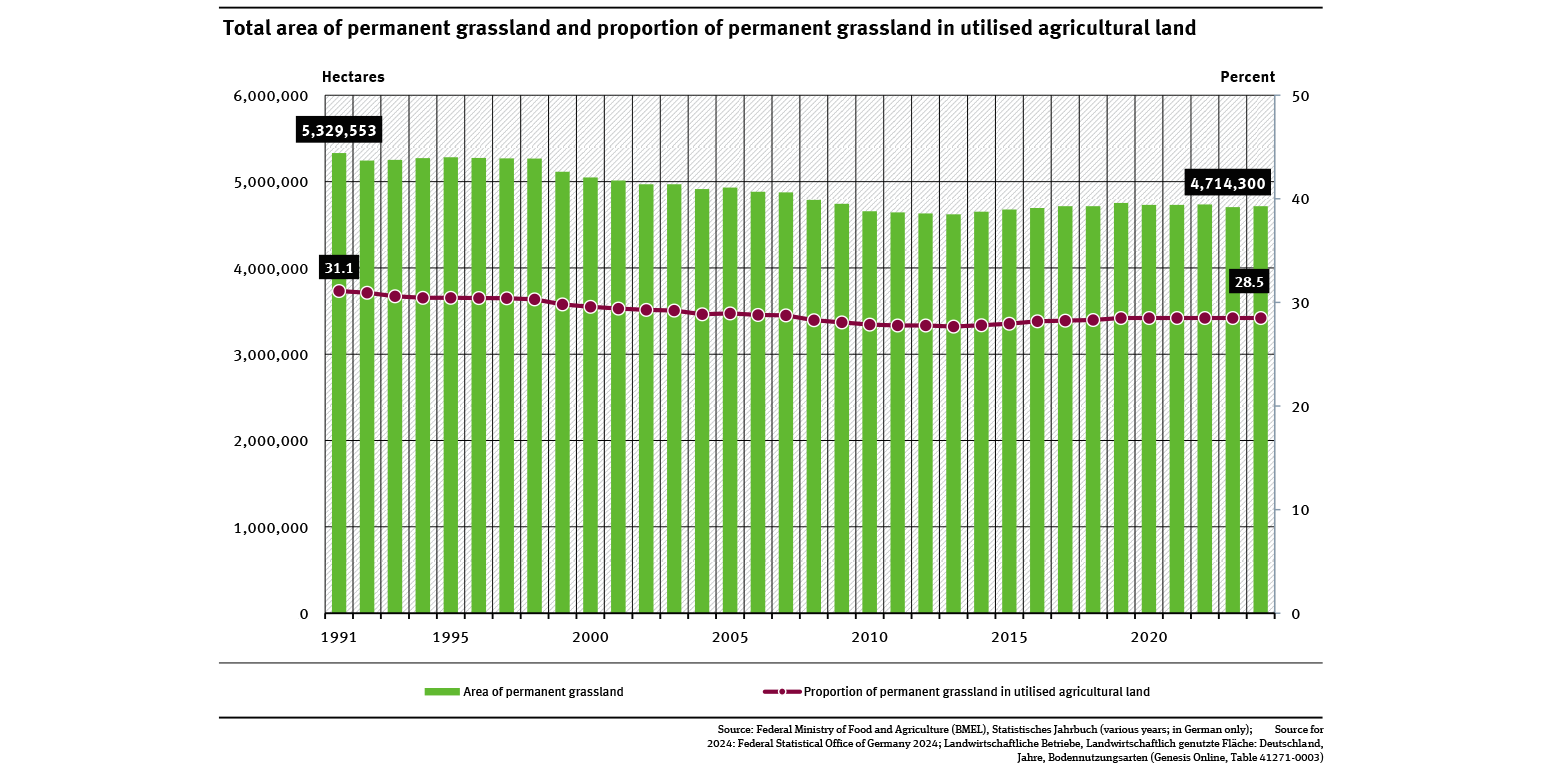
Total area of permanent grassland and proportion of permanent grassland ...
- Land- und Forstwirtschaft
- Diagramme
- Umwelt-Indikatoren
- Daten und Tabellen