Data Search


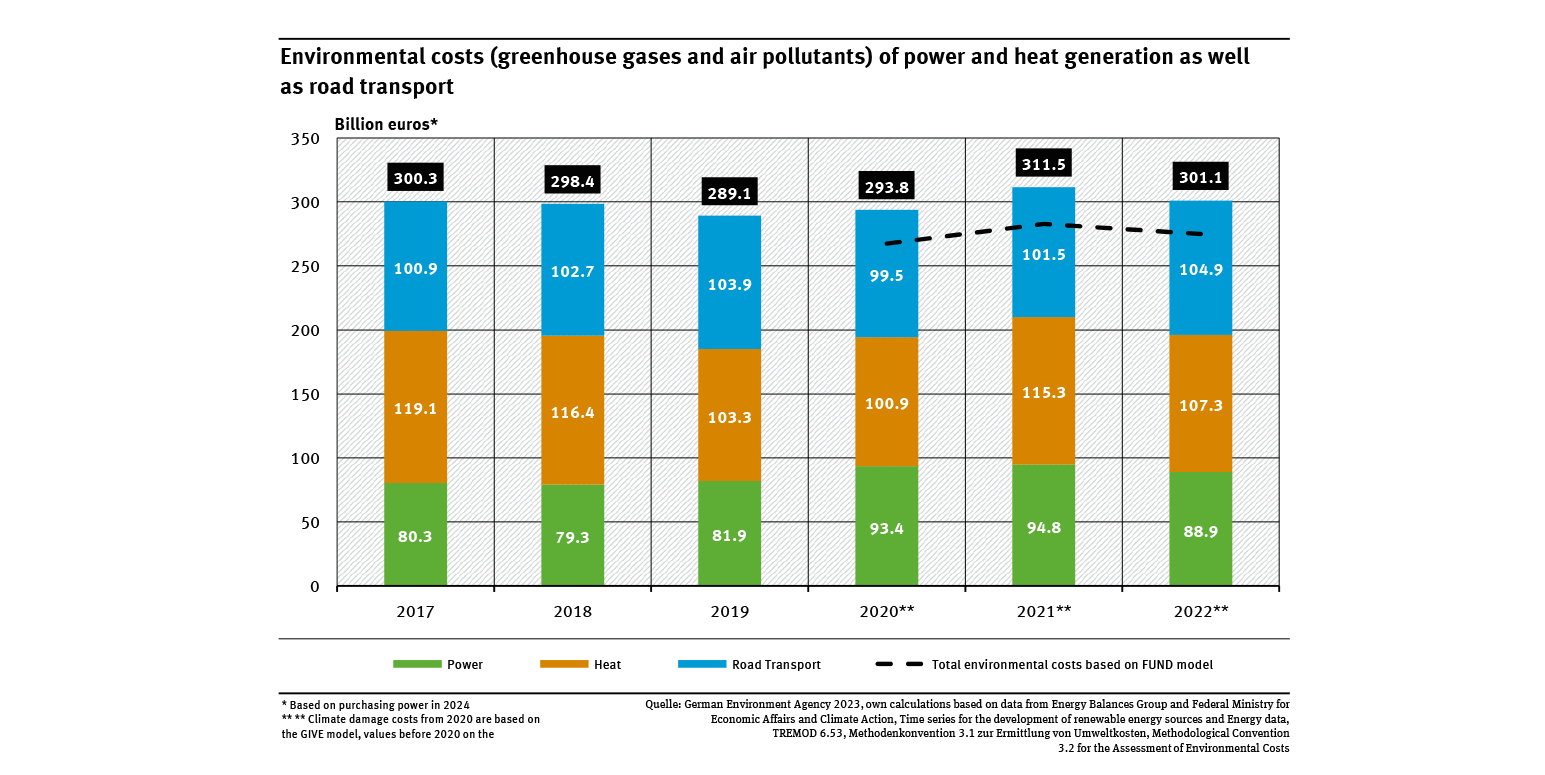
Environmental costs (greenhouse gases and air pollutants) of power and heat generation ...
- Luft
- Umwelt und Wirtschaft
- Diagramme
- Umwelt-Indikatoren
- Daten und Tabellen

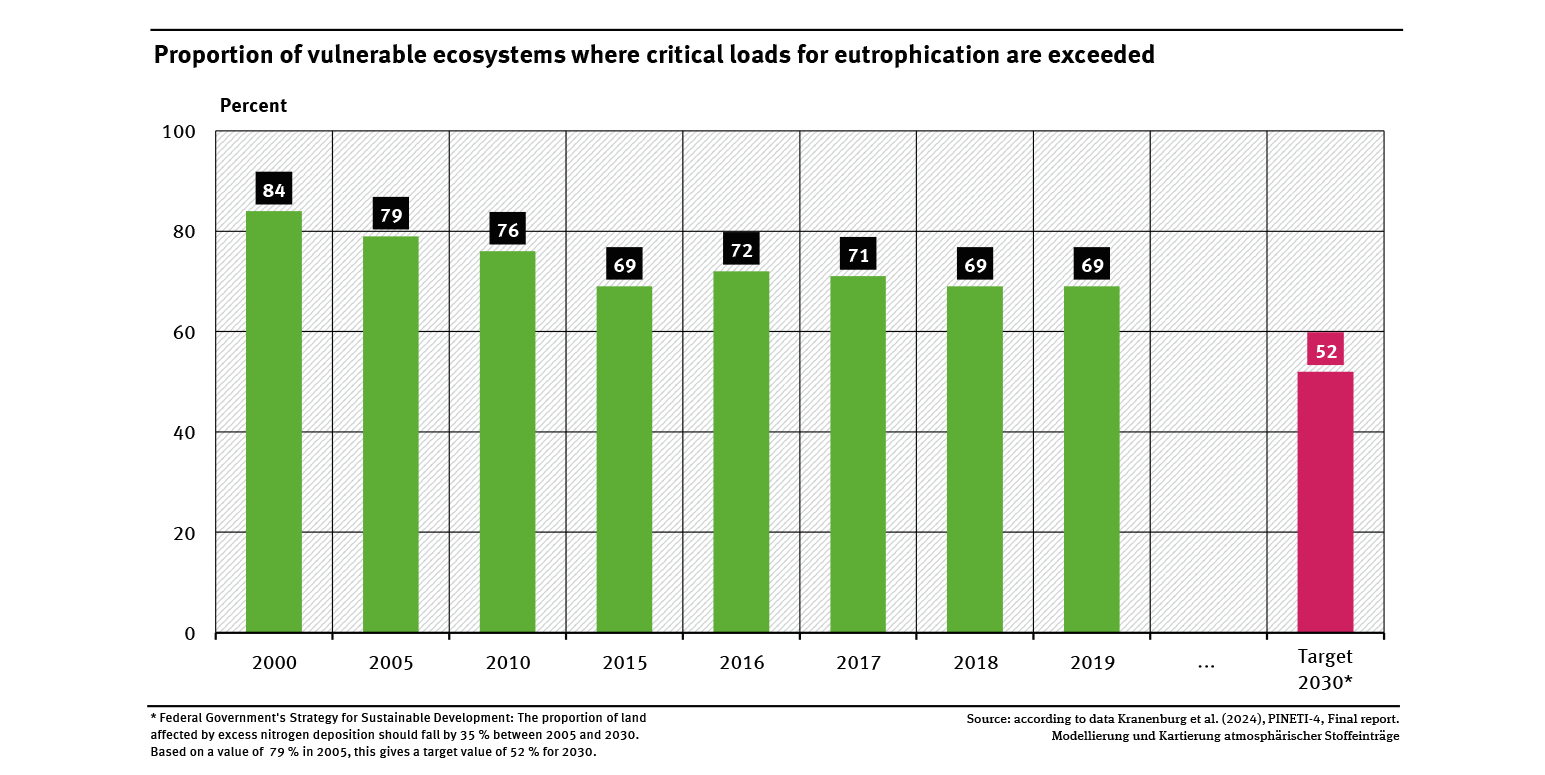
Proportion of vulnerable ecosystems where critical loads for eutrophication are exceeded
- Fläche, Boden, Land-Ökosysteme
- Diagramme
- Umwelt-Indikatoren
- Daten und Tabellen


Export data

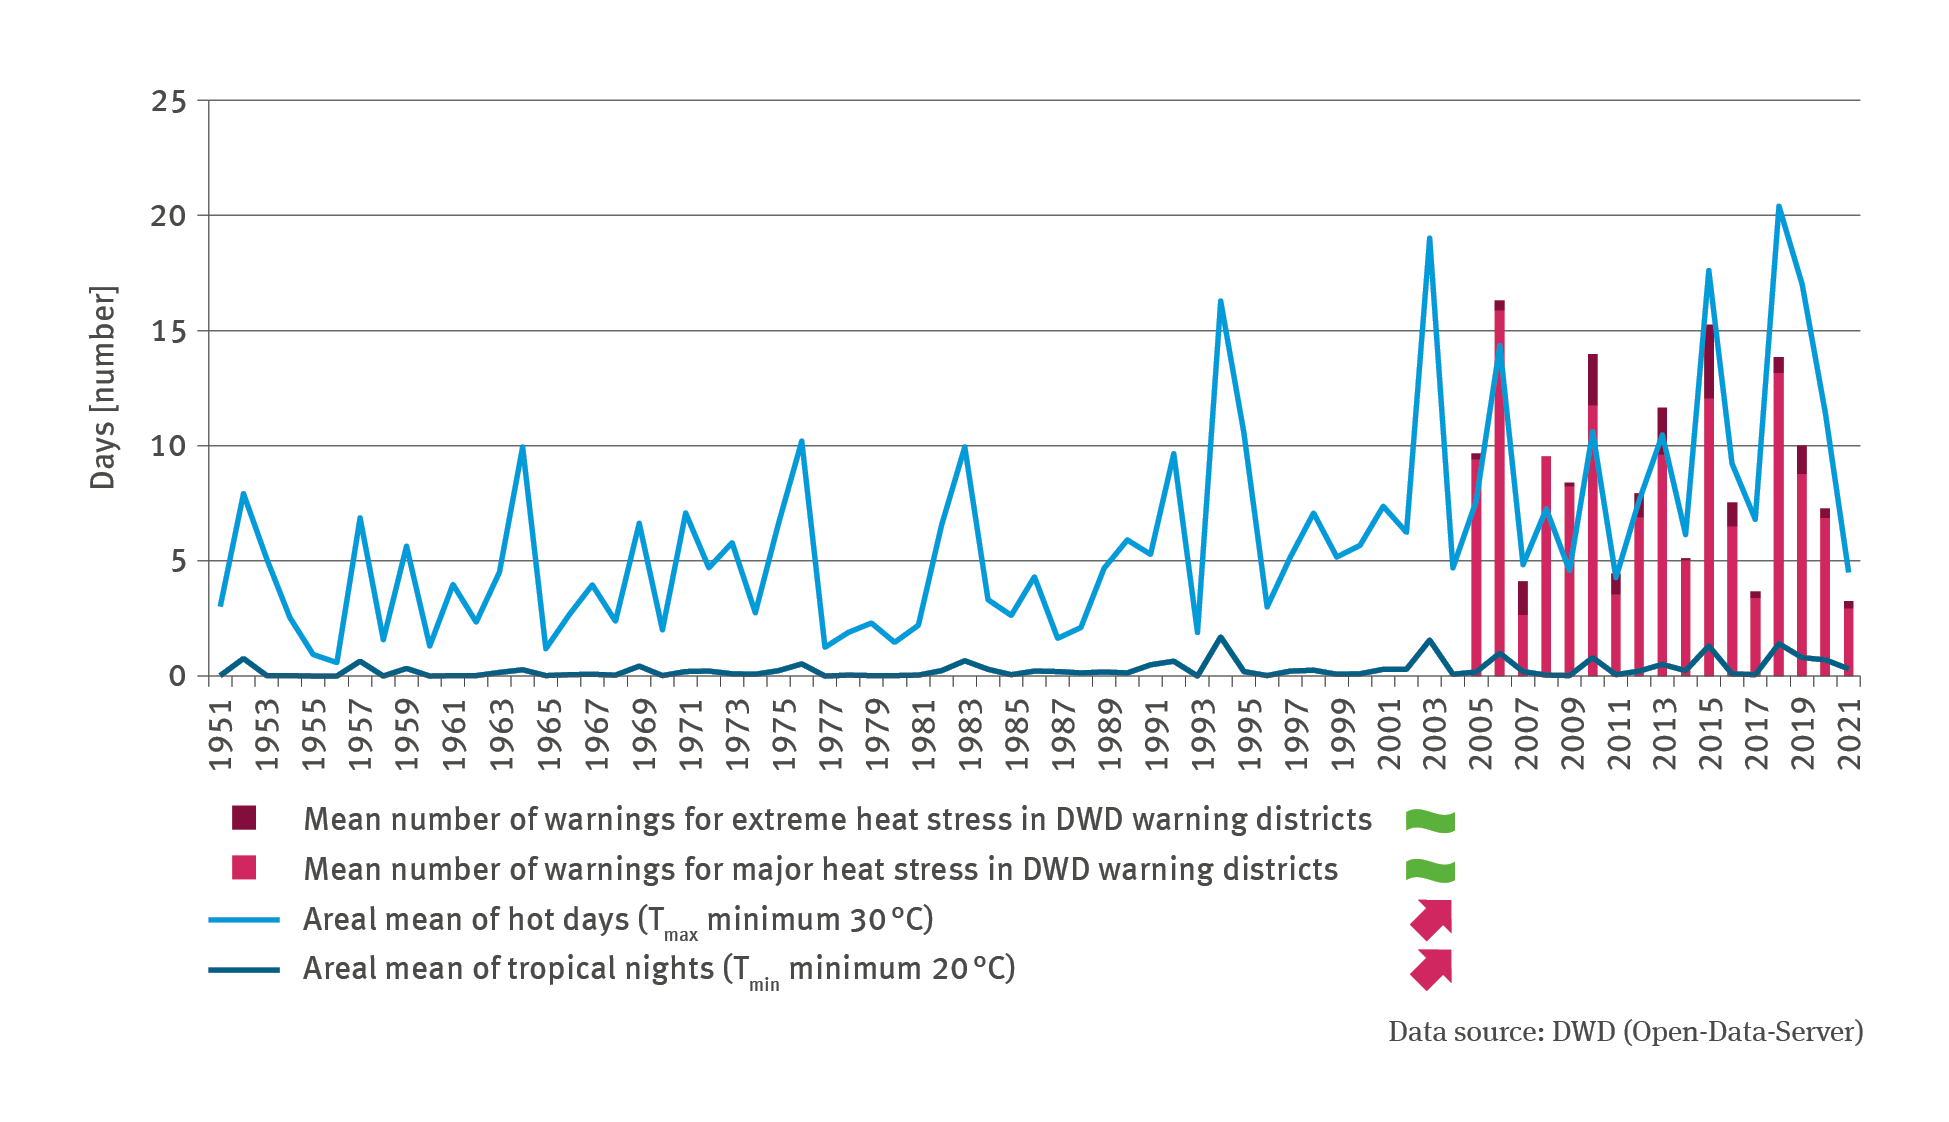
Figure 5: Deviation of the number of ice days (right) from the multi-annual mean 1961–1990
- Klima
- Diagramme
Export data