Data Search

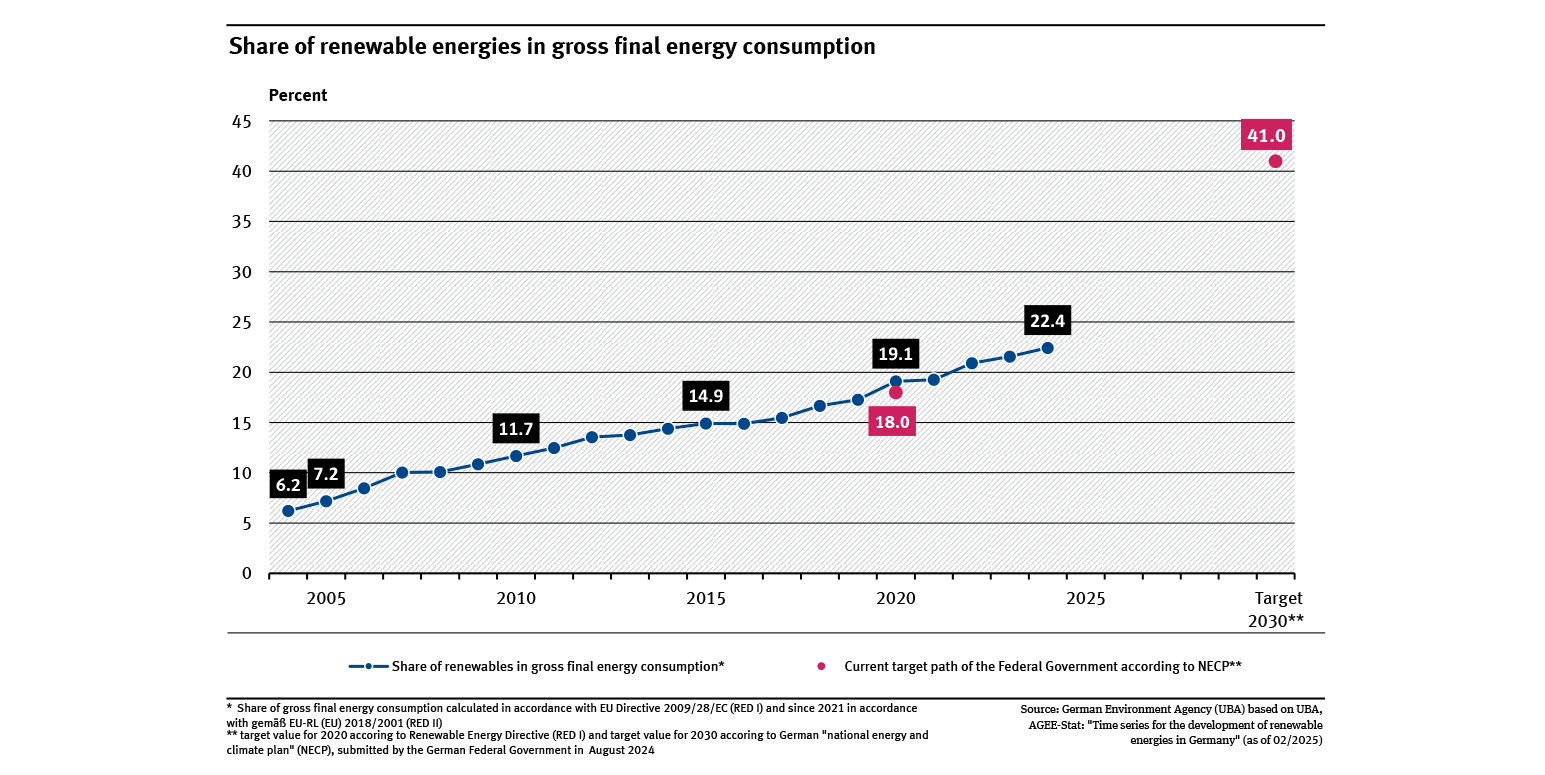
Share of renewable energies in gross final energy consumption
- Energie
- Diagramme
- Umwelt-Indikatoren
- Daten und Tabellen


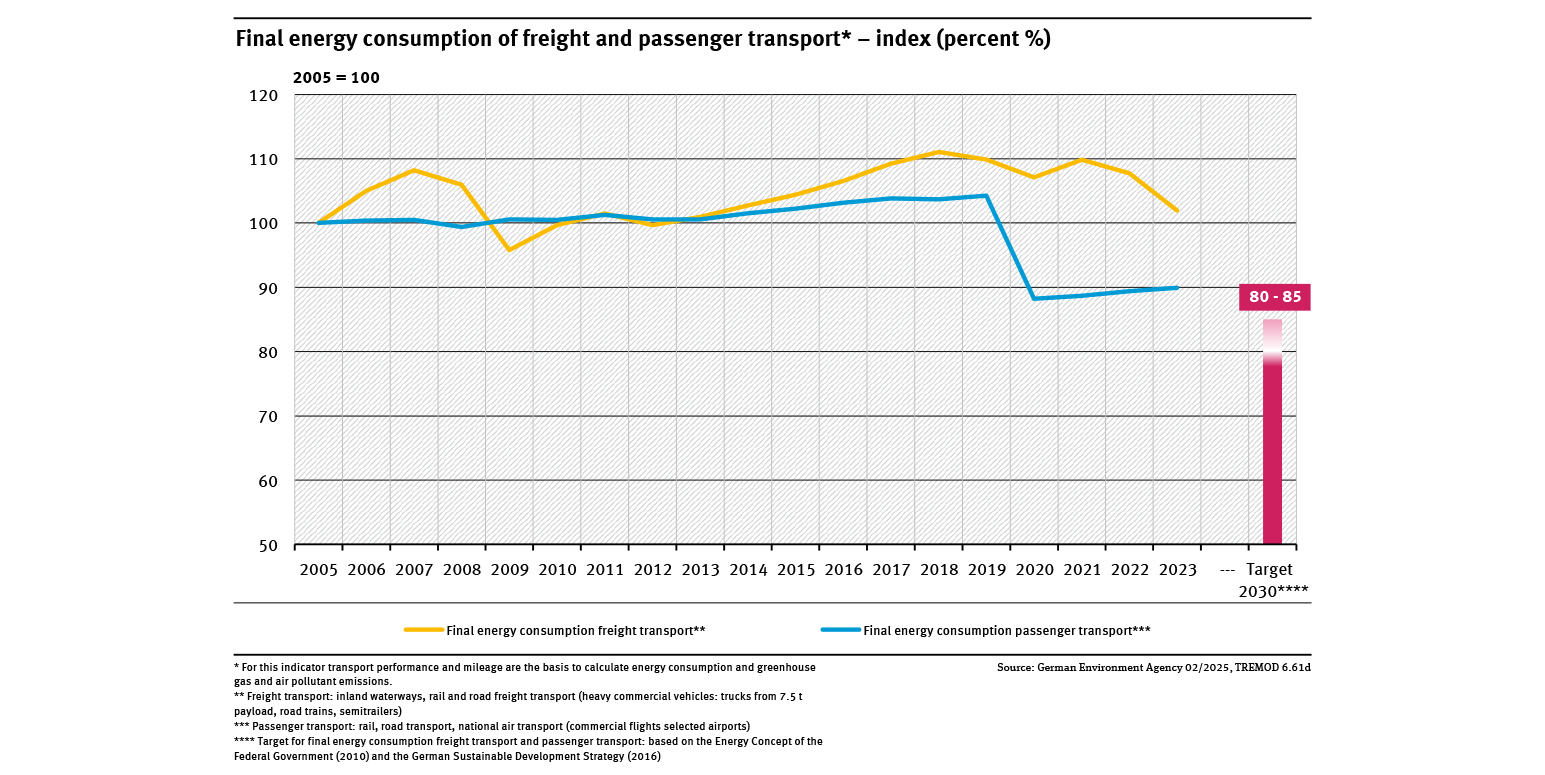
Final energy consumption of freight and passenger transport
- Energie
- Verkehr
- Diagramme
- Umwelt-Indikatoren
- Daten und Tabellen


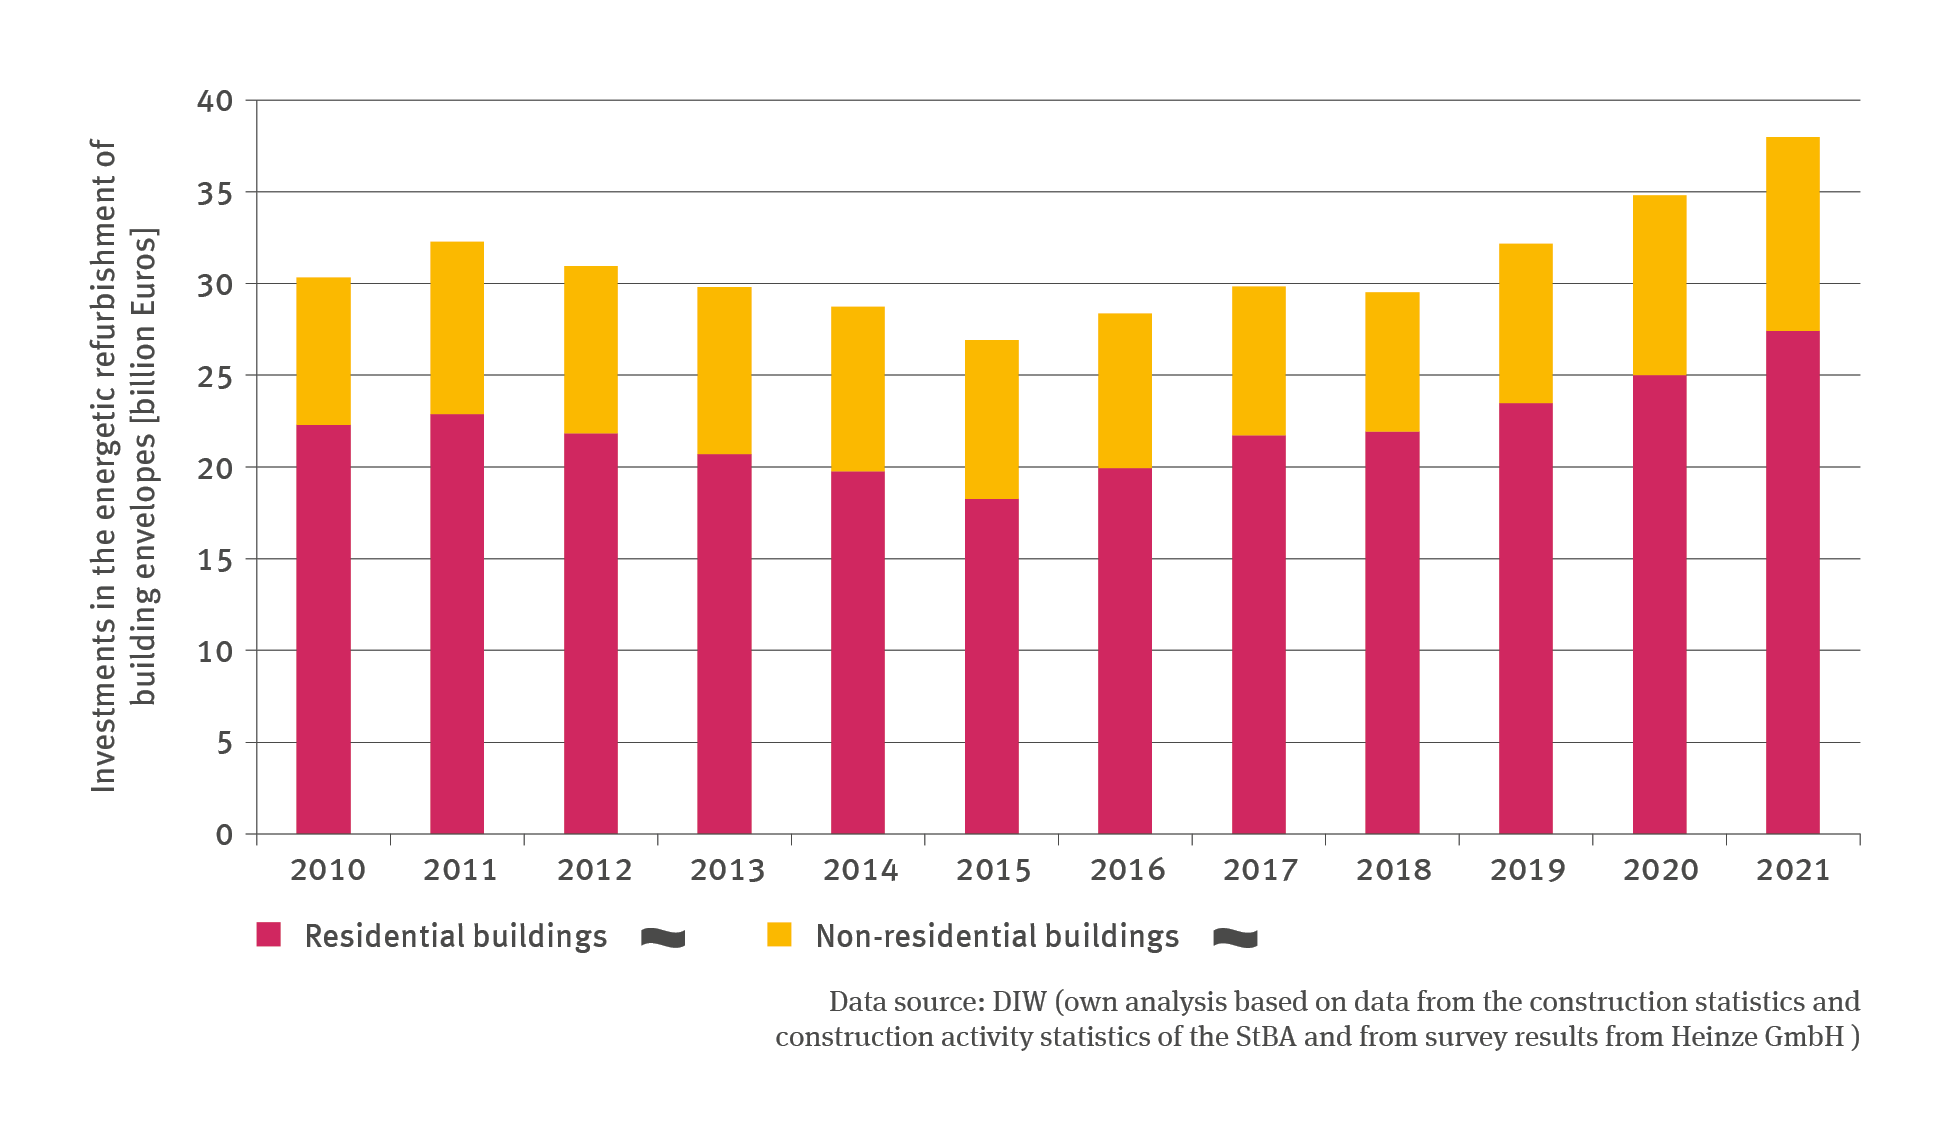
BAU-R-3: Investments in the energetic refurbishment of building envelopes
- Klima
- Energie
- Umwelt und Wirtschaft
- Diagramme
Export data

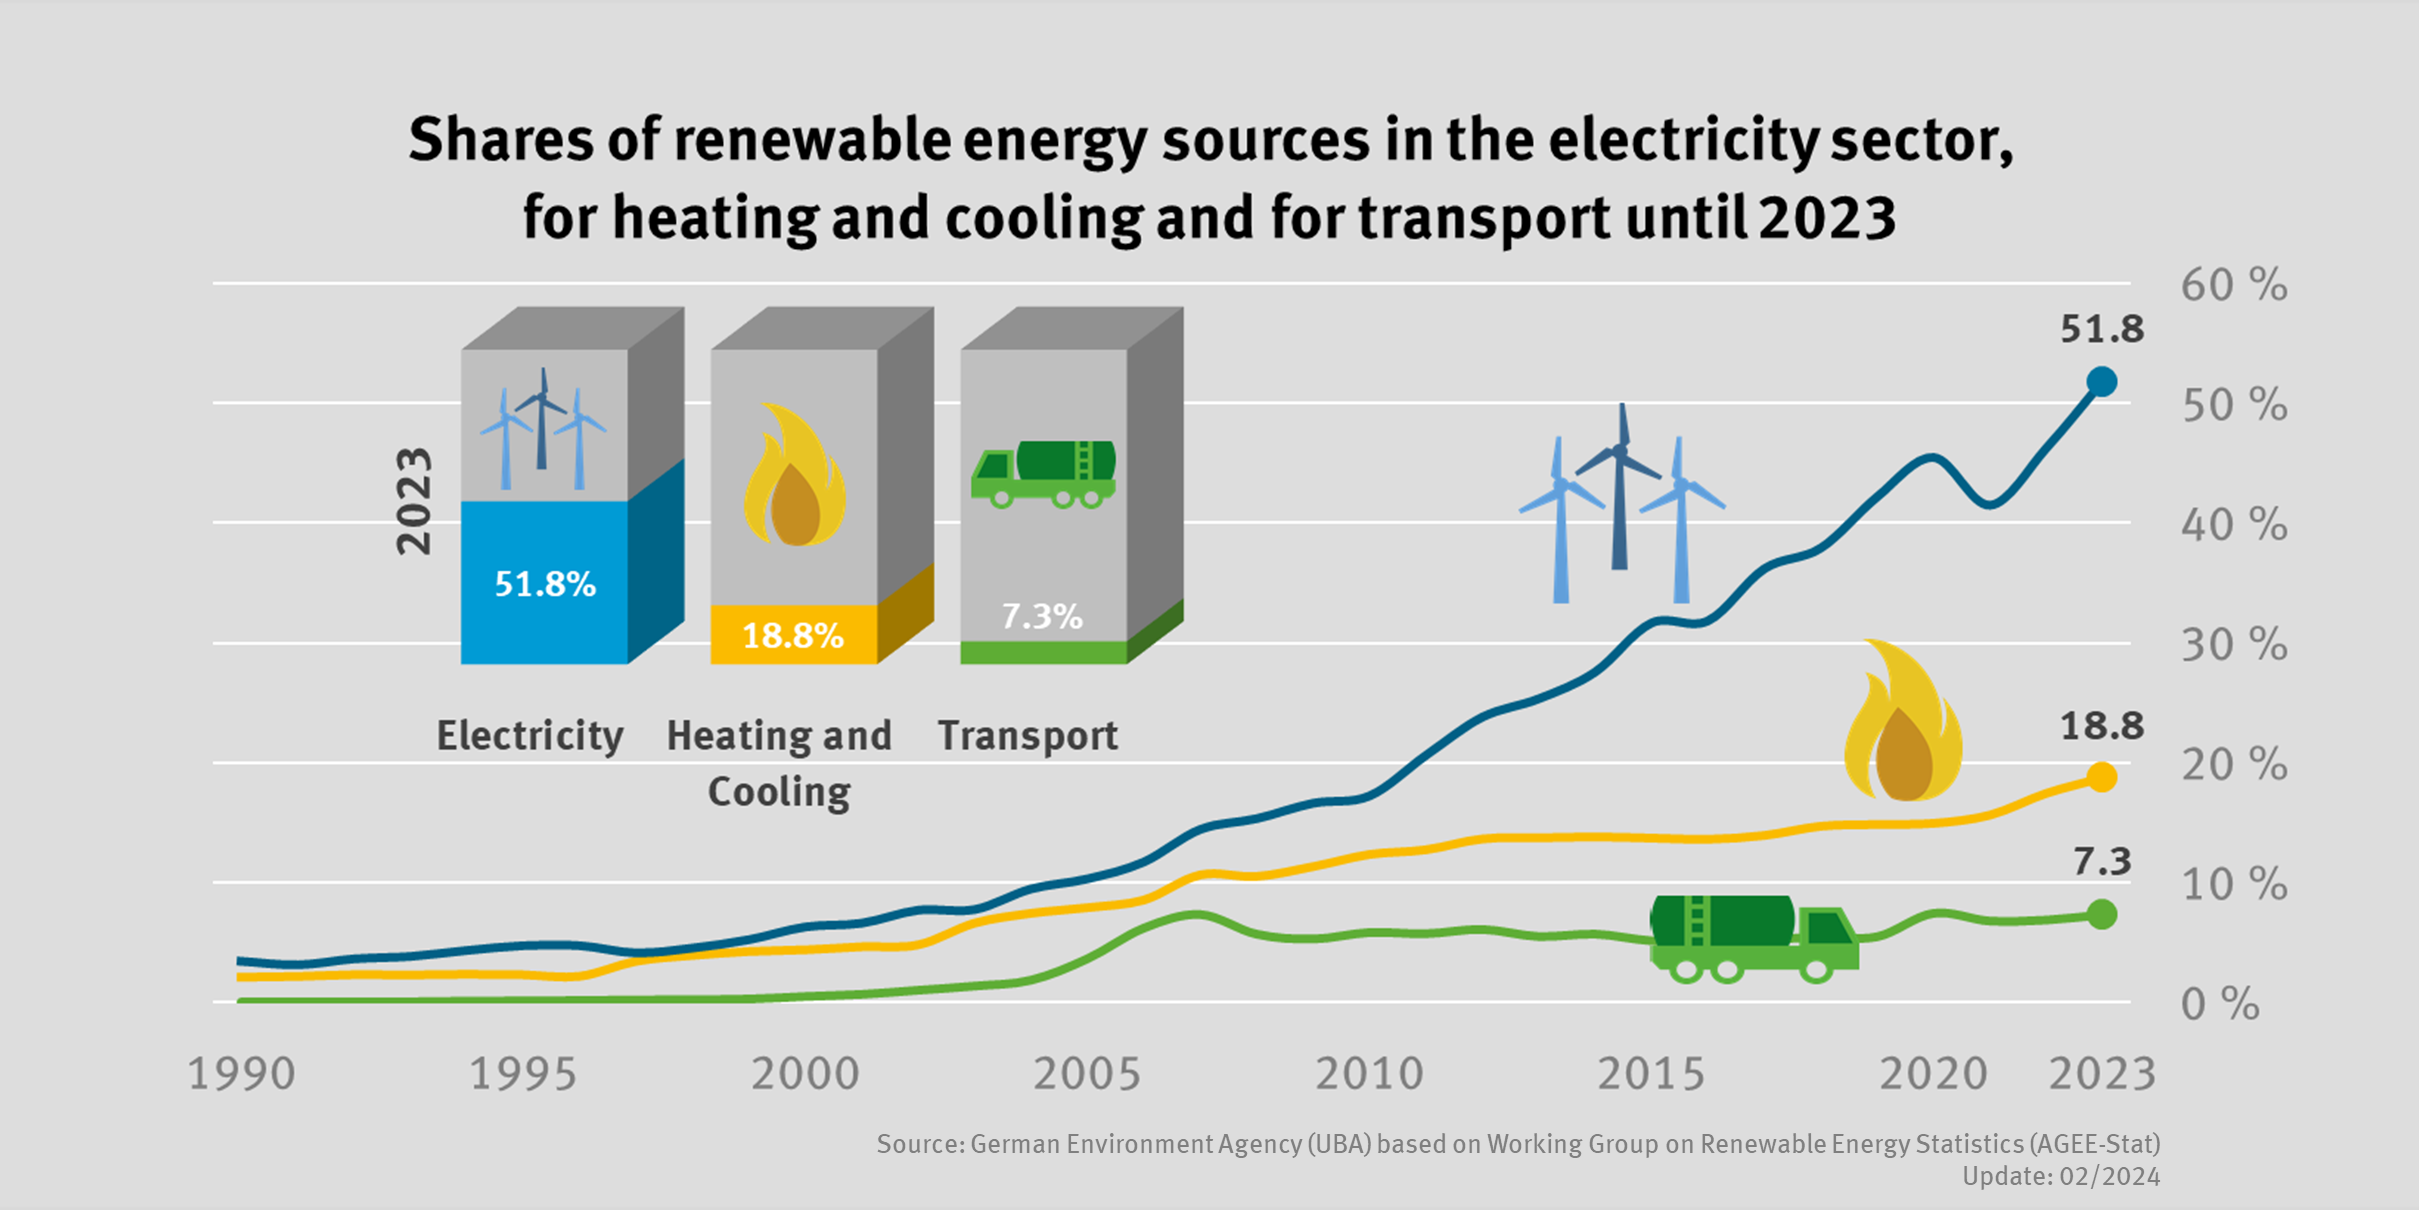
The share of renewable energies in the electricity, heating and transport sectors rose again in 2023
- Energie
- Diagramme
Export data

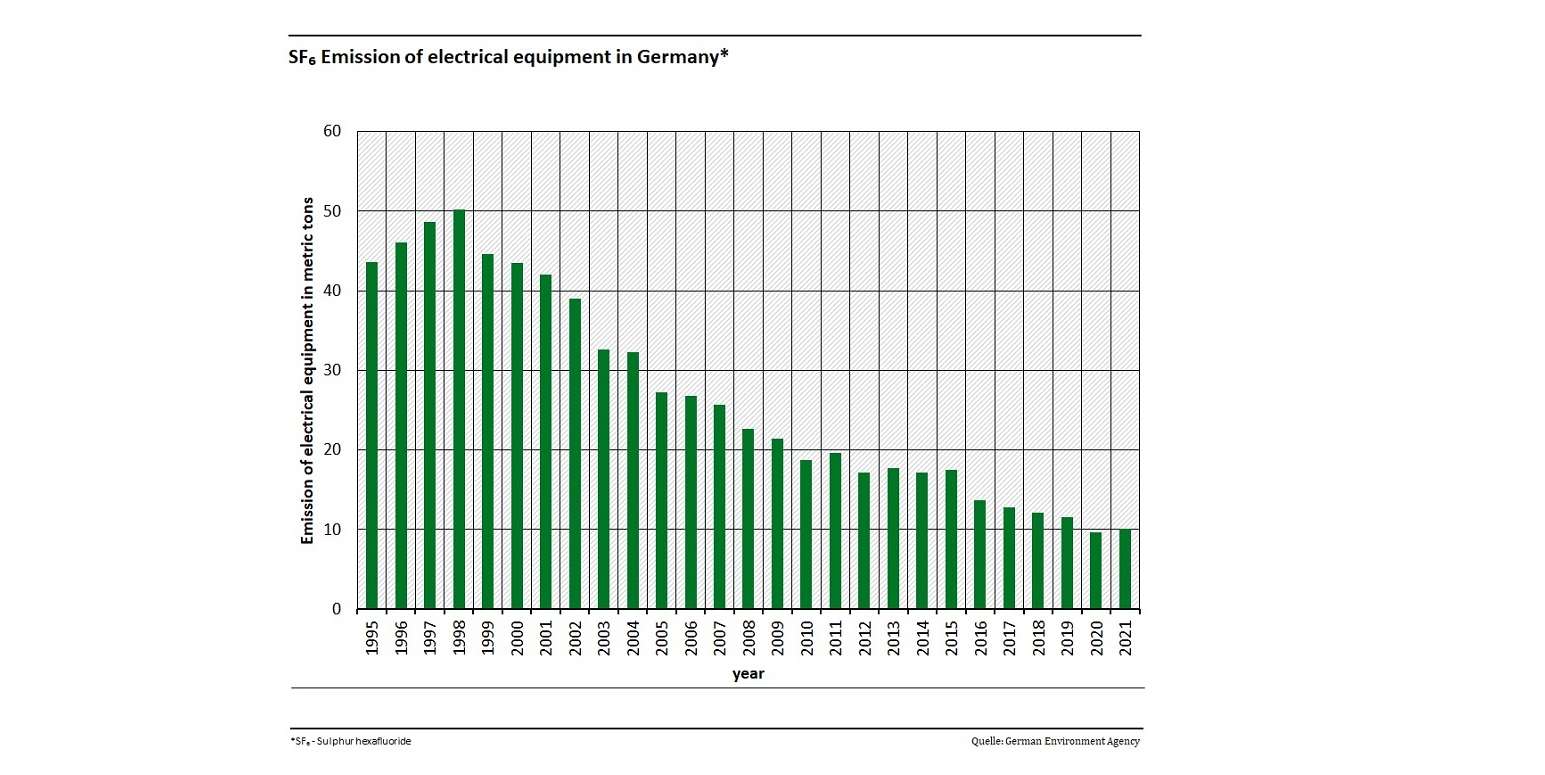
Emissions of electrical equipment in Germany
- Klima
- Energie
- Umwelt und Wirtschaft
- Diagramme
Export data

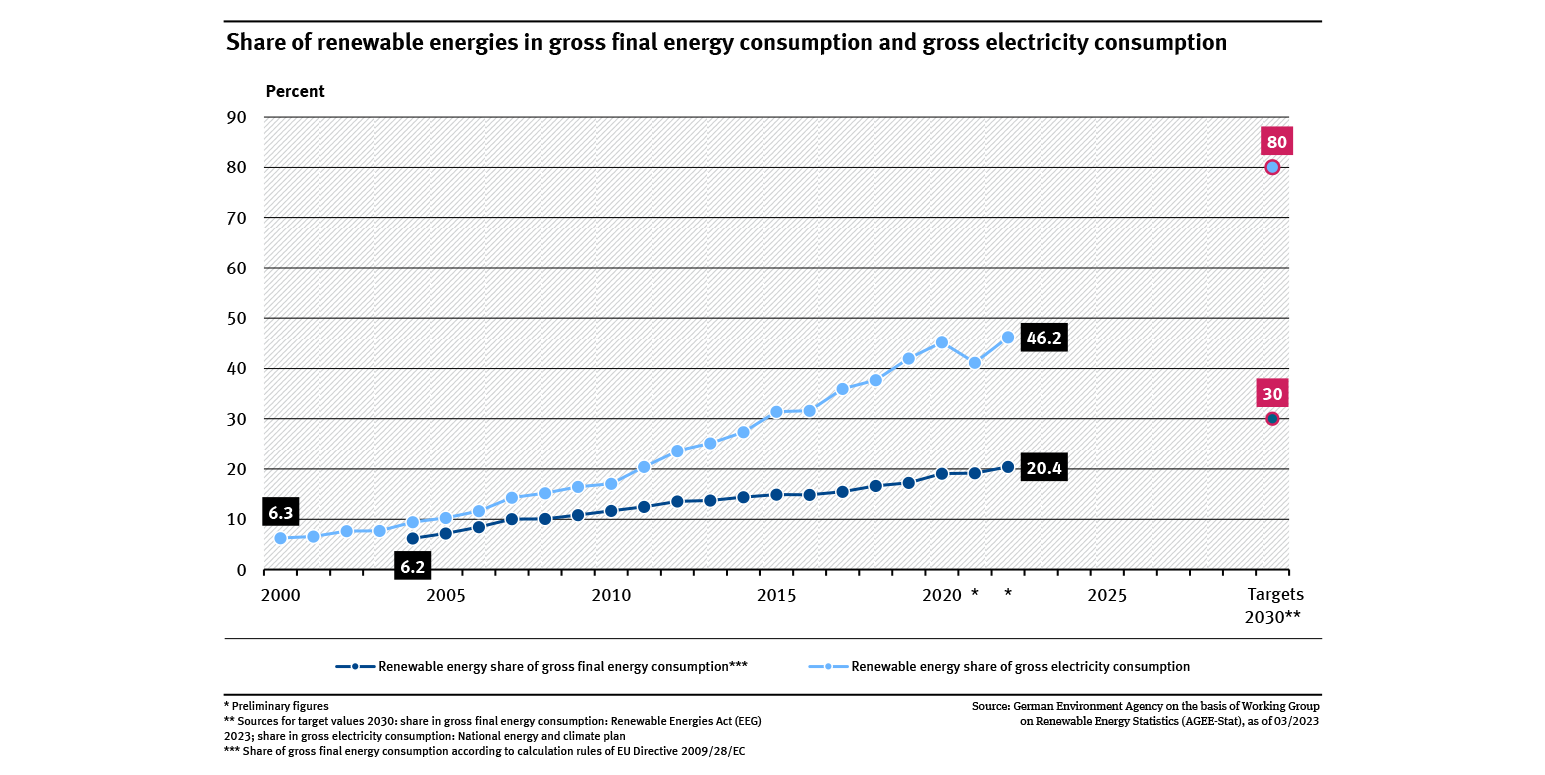
Renewable energy share in gross final energy consumption and gross electricity consumption
- Energie
- Diagramme
- Umwelt-Indikatoren
- Daten und Tabellen

