Skip to main content Skip to main menu Skip to footer

Data Search

Data Search

Here you will find diagrams, infographics, maps and tables for direct download.

Data Search

A bar-chart shows the population-weighted annual average PM2.5 exposure for Germany from 2010 to 2023. The exposure decreased significantly by 54 % from 2010 to 2023.

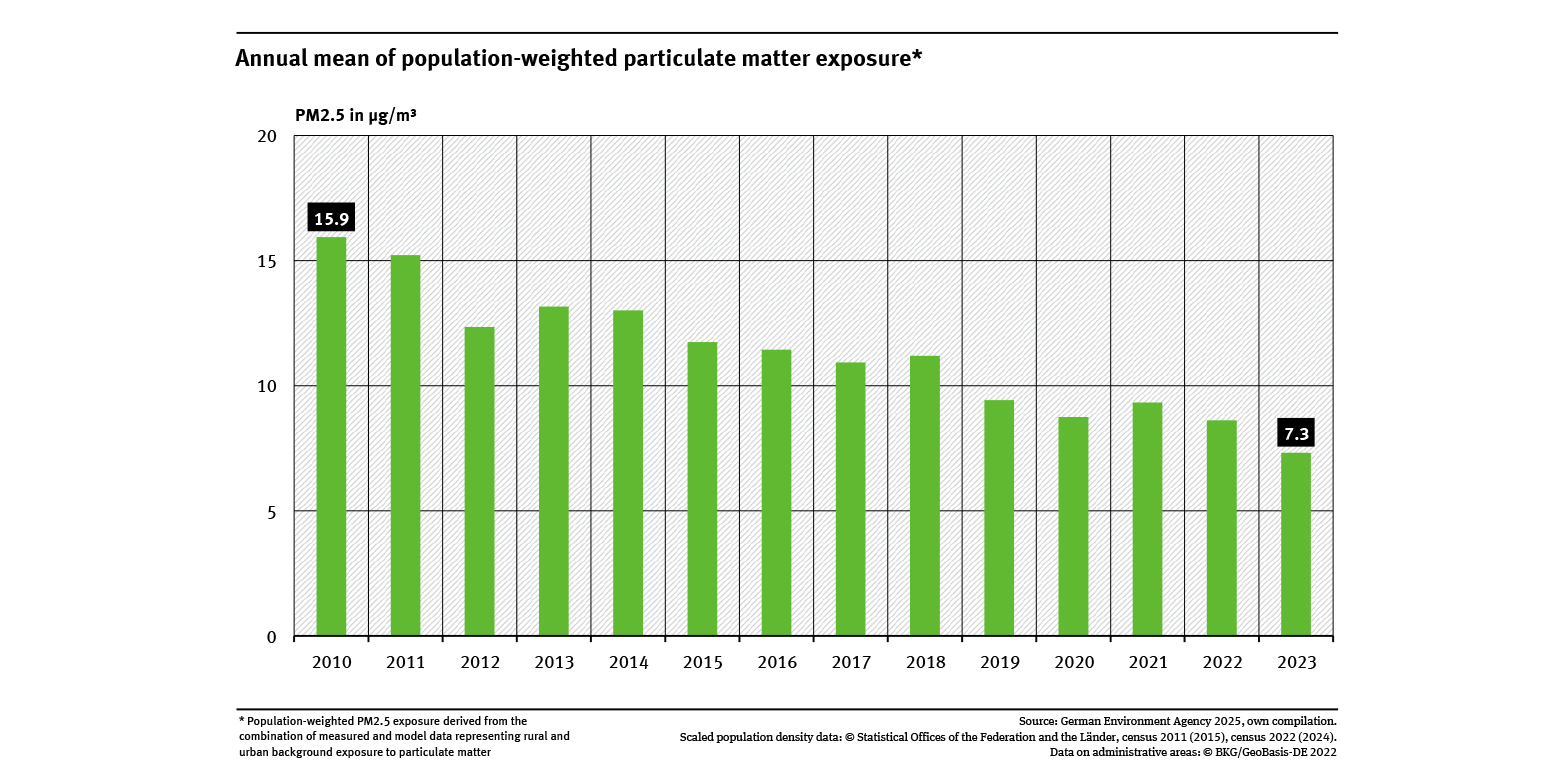
Annual mean of population-weighted particulate matter exposure

  • Luft
  • Umwelt und Gesundheit
  • Diagramme
  • Umwelt-Indikatoren
  • Daten und Tabellen
Export data
A graph shows the proportion of people in Germany affected by levels exceeding the WHO guideline value and the EU limit value for fine particulate matter (PM2.5) (legally binding from 2030) for the period from 2010 to 2023 – with a declining trend considering the EU limit value.

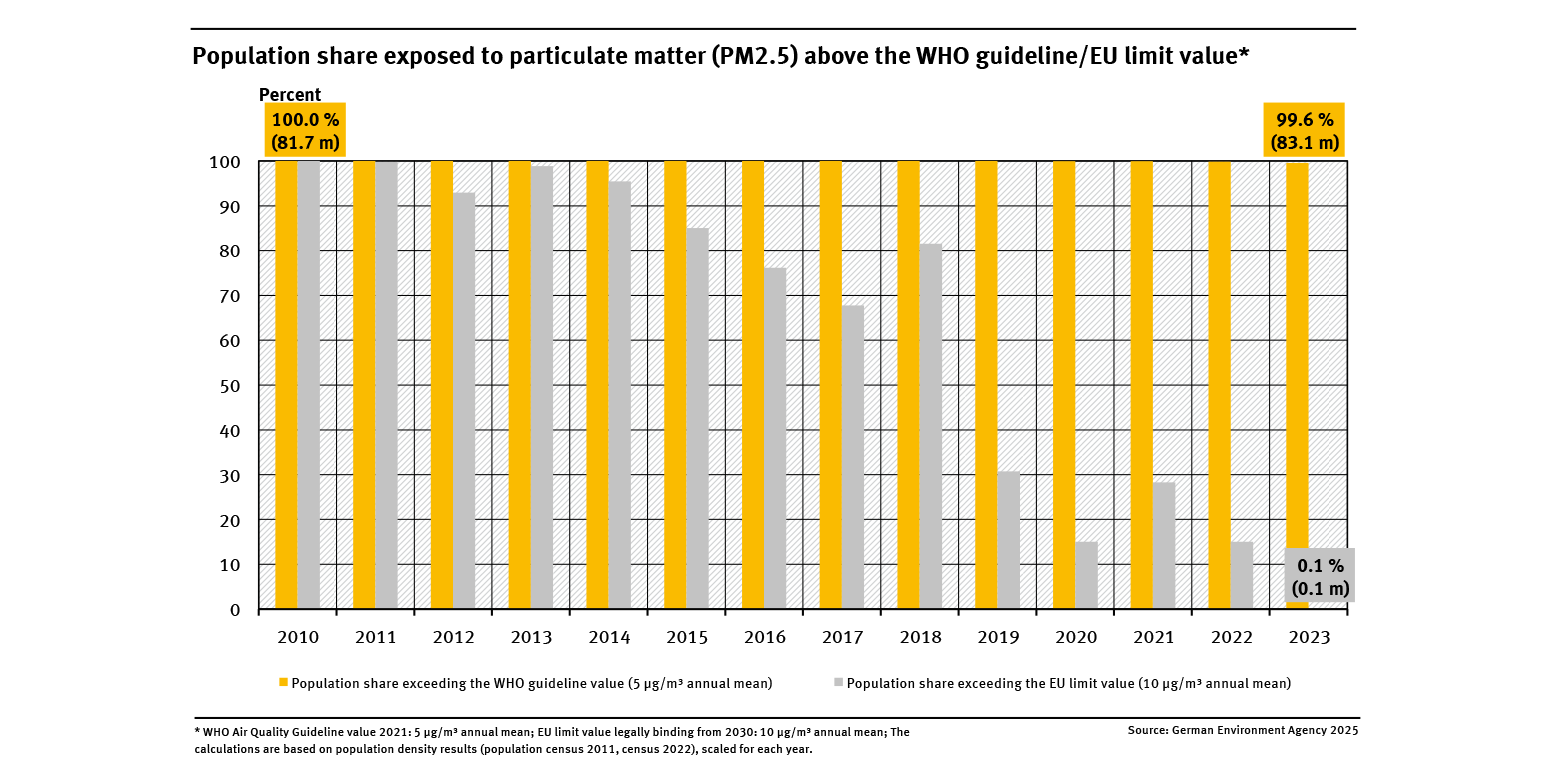
Population share exposed to particulate matter (PM2.5) above the WHO guideline/EU limit value

  • Luft
  • Umwelt und Gesundheit
  • Diagramme
  • Umwelt-Indikatoren
  • Daten und Tabellen
Export data
A graph shows the increase of the share of organic farming areas in total utilised agricultural area based on data of the German Federal Statistical Office and the BMLEH. It also shows the 30 percent target of the Federal Government.

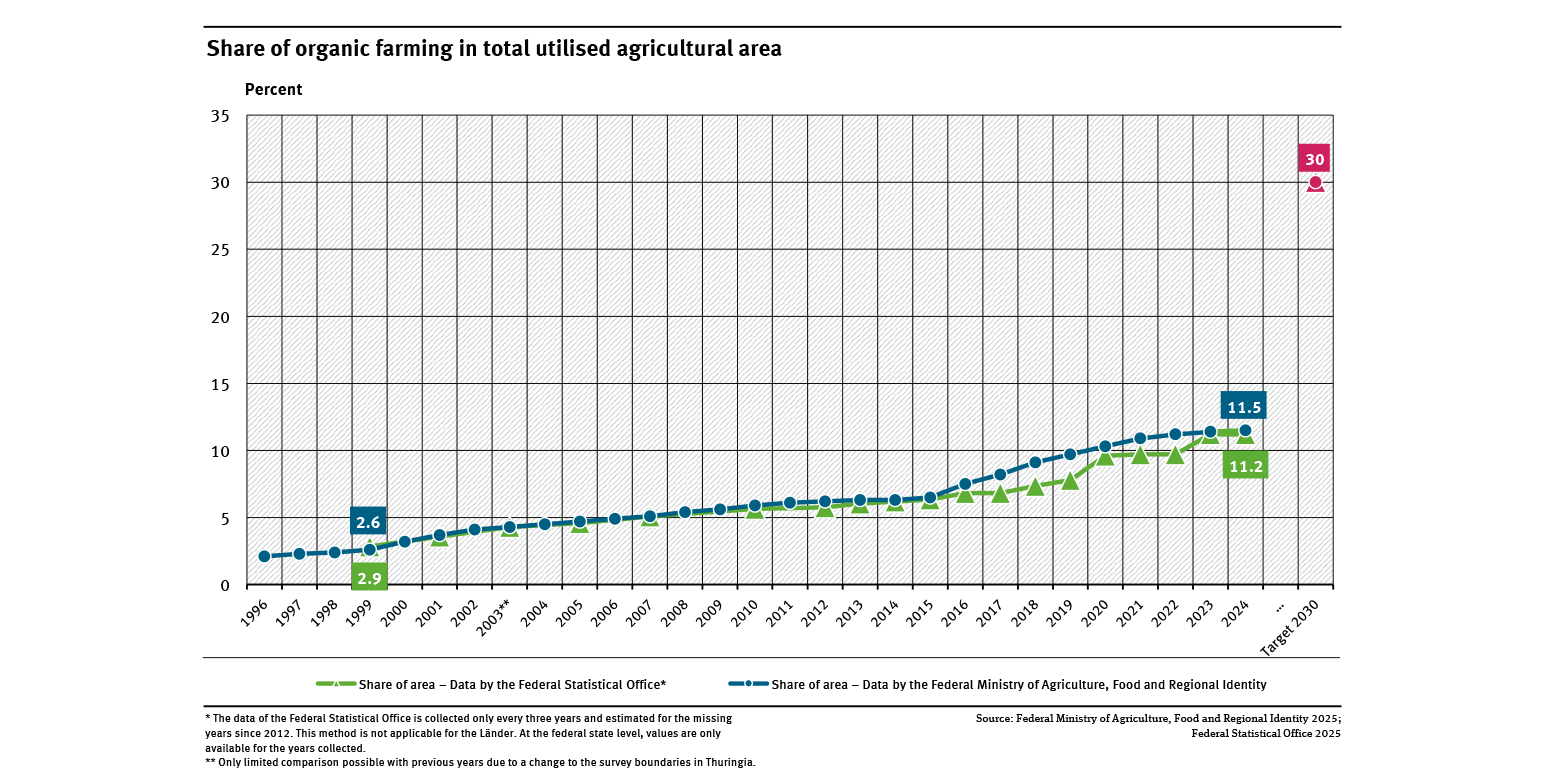
Share of organic farming in total utilised agricultural area

  • Land- und Forstwirtschaft
  • Diagramme
  • Umwelt-Indikatoren
  • Daten und Tabellen
Export data
Graph: The development of emissions of five air pollutants and an overall index relative to the base year 2005 (=100 %) can be seen. The trend of all substances decreases significantly, but ammonia only since 2014. The 2030 target (55 %) seems within reach.

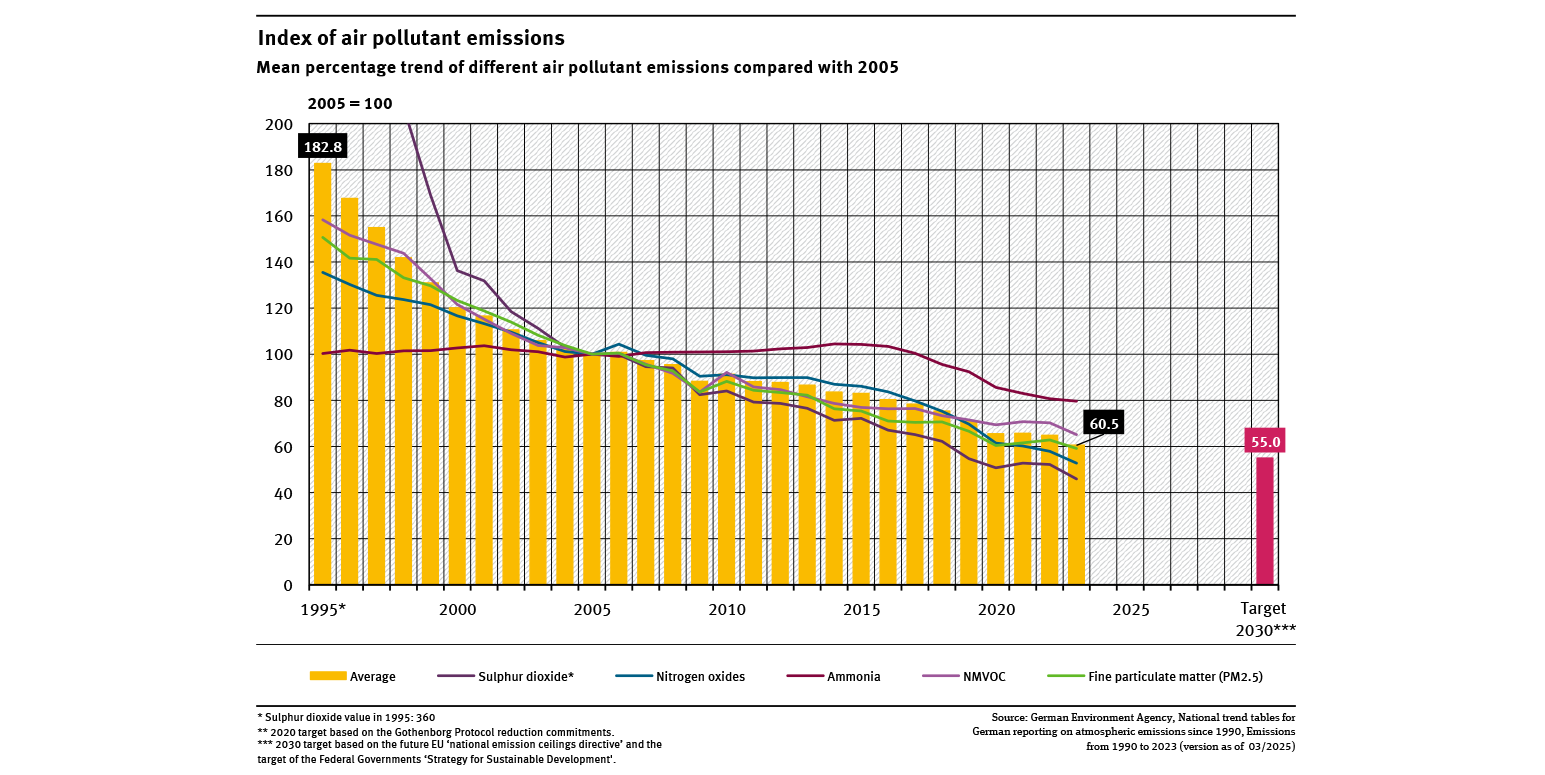
Index of air pollutant emissions

  • Luft
  • Diagramme
  • Umwelt-Indikatoren
  • Daten und Tabellen
Export data
A graph shows the development of environmental taxes for the year 1995 (39.9 billion euros), the year 2000, and the period 2005 to 2023 (69.5 billion euros, preliminary data) as well as their share of total tax revenues in the public budgets.

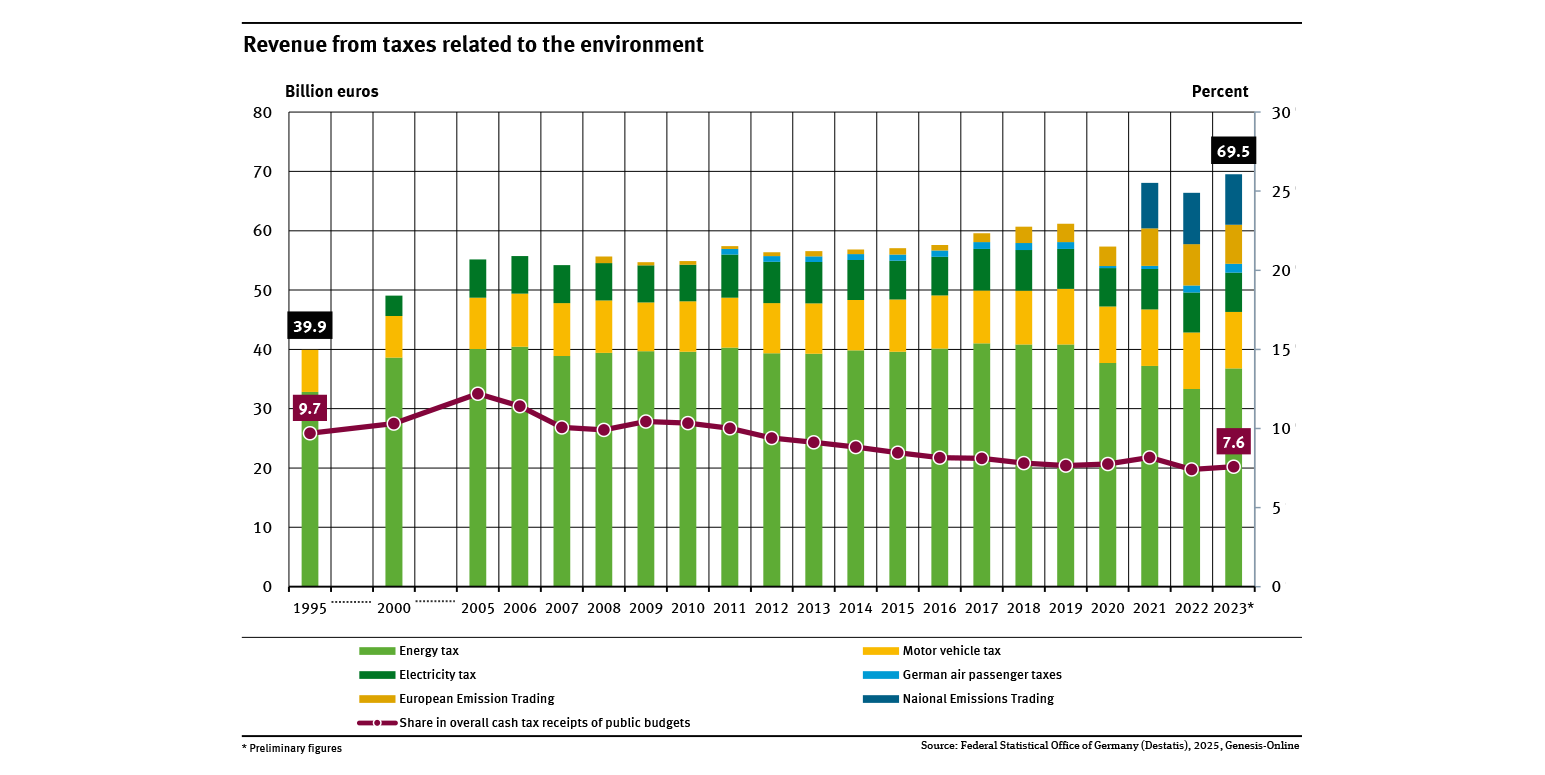
Revenue from taxes to the environment

  • Umwelt und Wirtschaft
  • Diagramme
  • Umwelt-Indikatoren
  • Daten und Tabellen
Export data
A graph shows the 5-year averages for 2003 to 2023 of the proportion of fulmars with stomachs containing over 0.1 grammes of plastic. The indicator has declined slightly and is at 48 %.

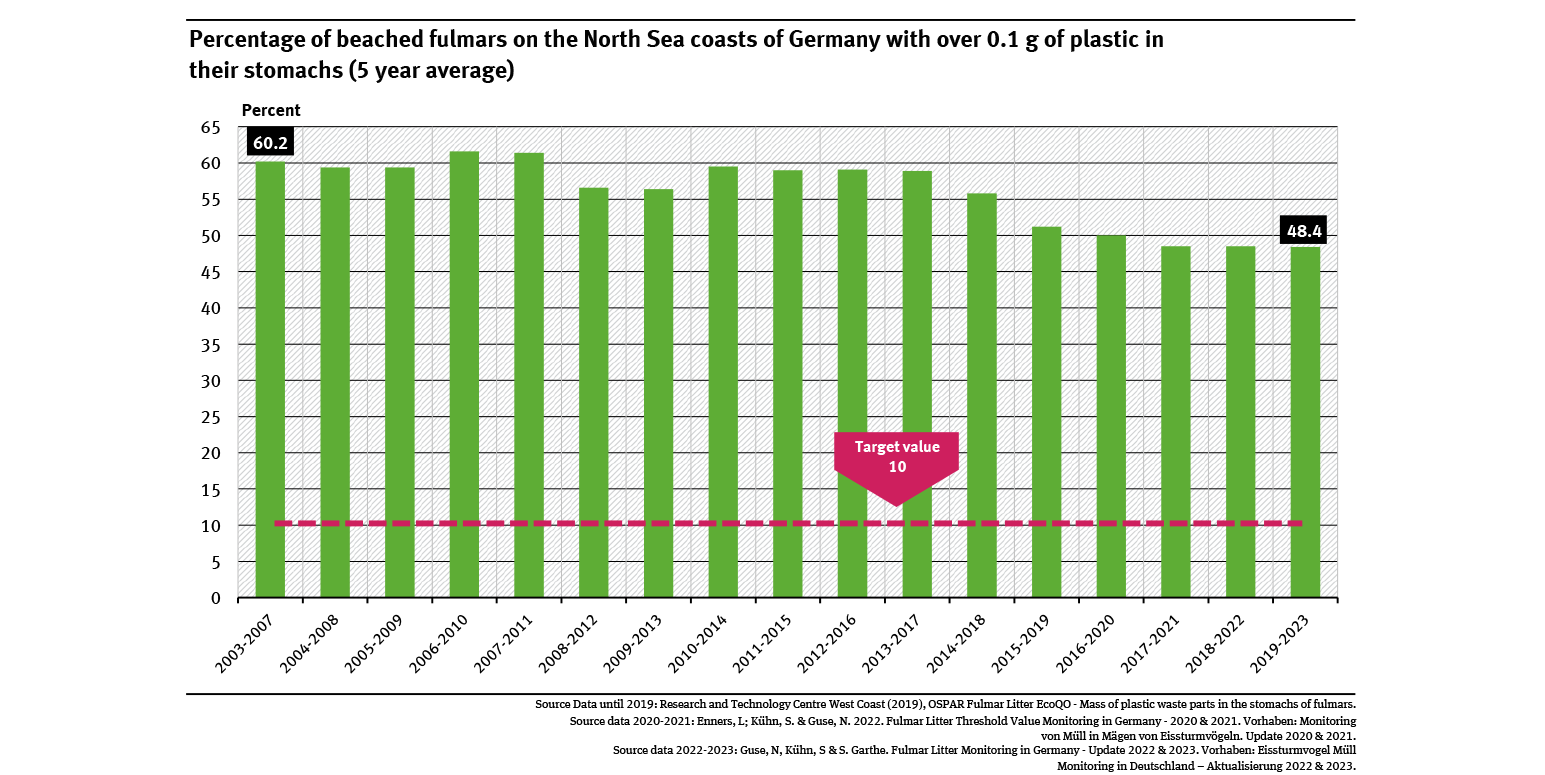
Percentage of beached fulmars on the North Sea coasts of Germany with over 0.1 g of plastic ...

  • Wasser
  • Diagramme
  • Umwelt-Indikatoren
  • Daten und Tabellen
Export data
A graph shows the development of EMAS registered organisations in Germany between 2005 and 2024, sorted by number of organisations, sites and employees. The target of the Sustainability Strategy (5,000 sites by 2030) is also shown.

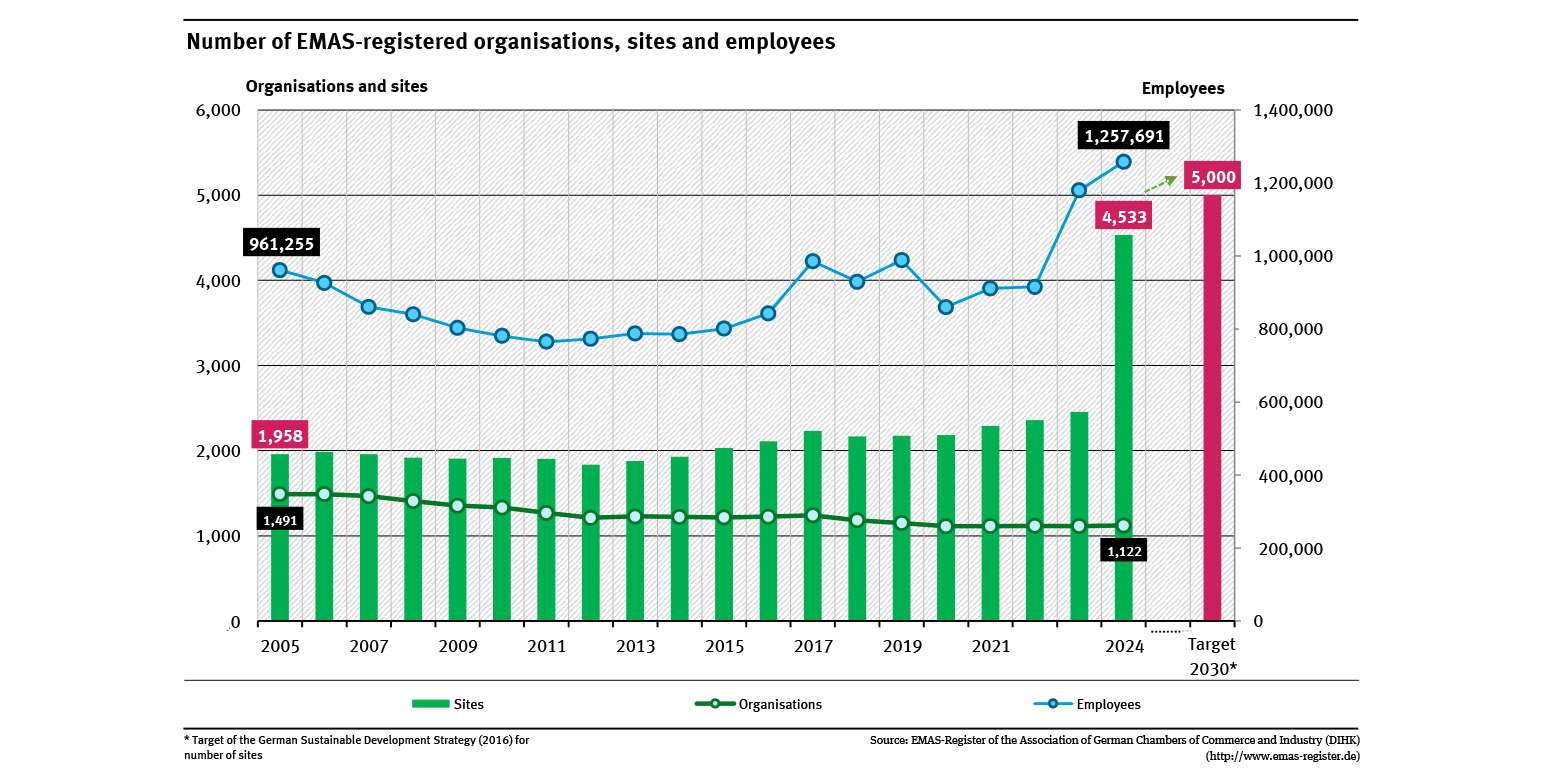
Number of EMAS-registered organisations, sites and employees

  • Umwelt und Wirtschaft
  • Diagramme
  • Umwelt-Indikatoren
  • Daten und Tabellen
Export data
A graph shows the total raw material productivity plus the primary raw material inputs and the sum of gross domestic product and the value imports from 2010 to 2022 (2010 = 100).

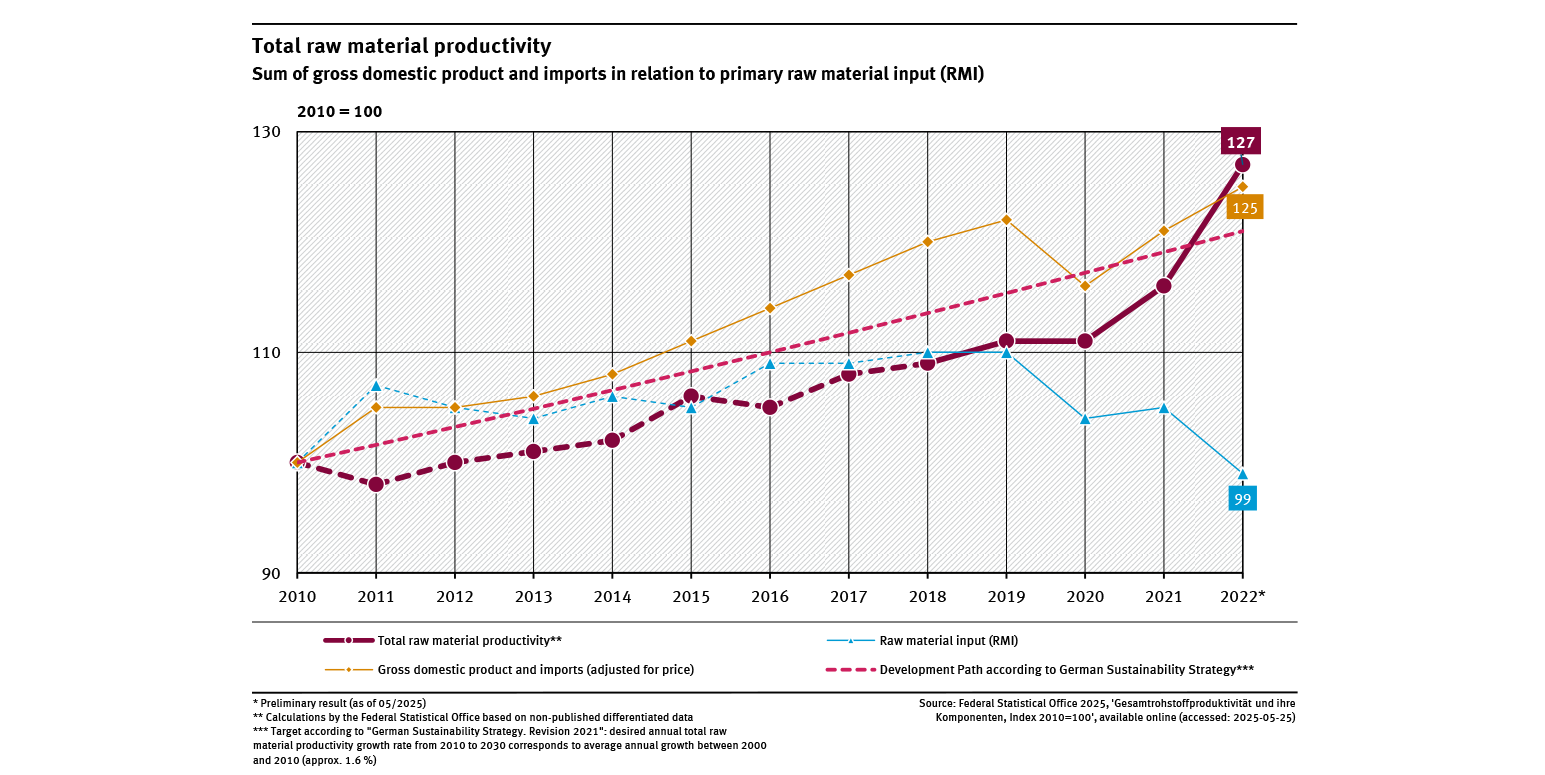
Total raw material productivity

  • Ressourcen und Abfall
  • Diagramme
  • Umwelt-Indikatoren
  • Daten und Tabellen
Export data
A graph for three air pollutants shows the extent to which the WHO recommendations from 2021 will be exceeded on average in urban areas between 2000 and 2024. The development of the various pollutants varies. Between 2000 and 2024, values for NO2 are between 172 and 28 percent, for ozone between 44 and 28 percent and for PM2.5 between 255 and 61 percent

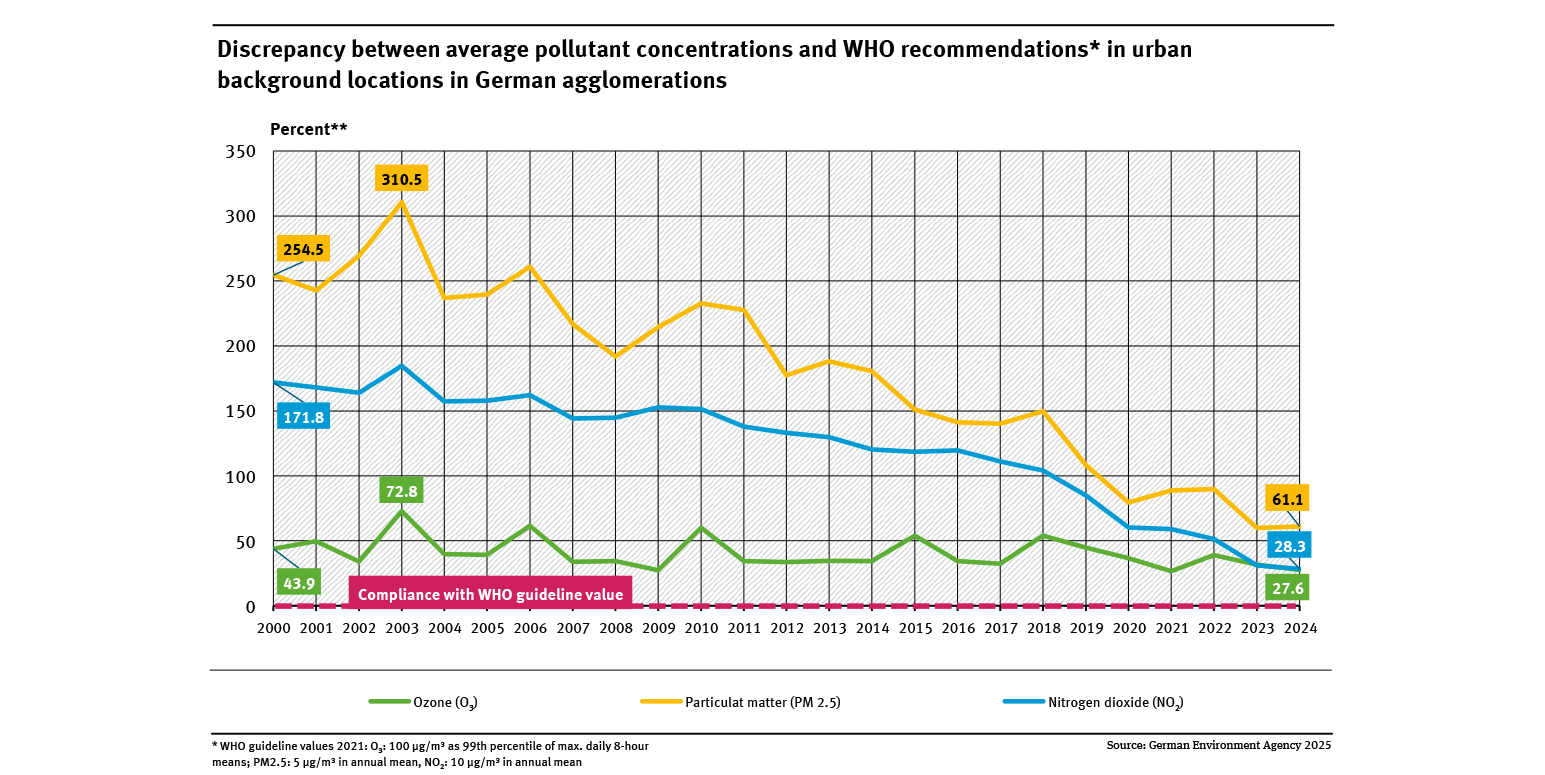
Discrepancy between average pollutant concentrations and WHO recommendations ...

  • Luft
  • Umwelt und Gesundheit
  • Diagramme
  • Umwelt-Indikatoren
  • Daten und Tabellen
Export data
A graph shows the employment in Green Tech and their share in the overall employment for 2010 until 2023. In 2023 about 3.4 million people were employed in this sector. The share was 7.5 percent in 2023 of all employees.

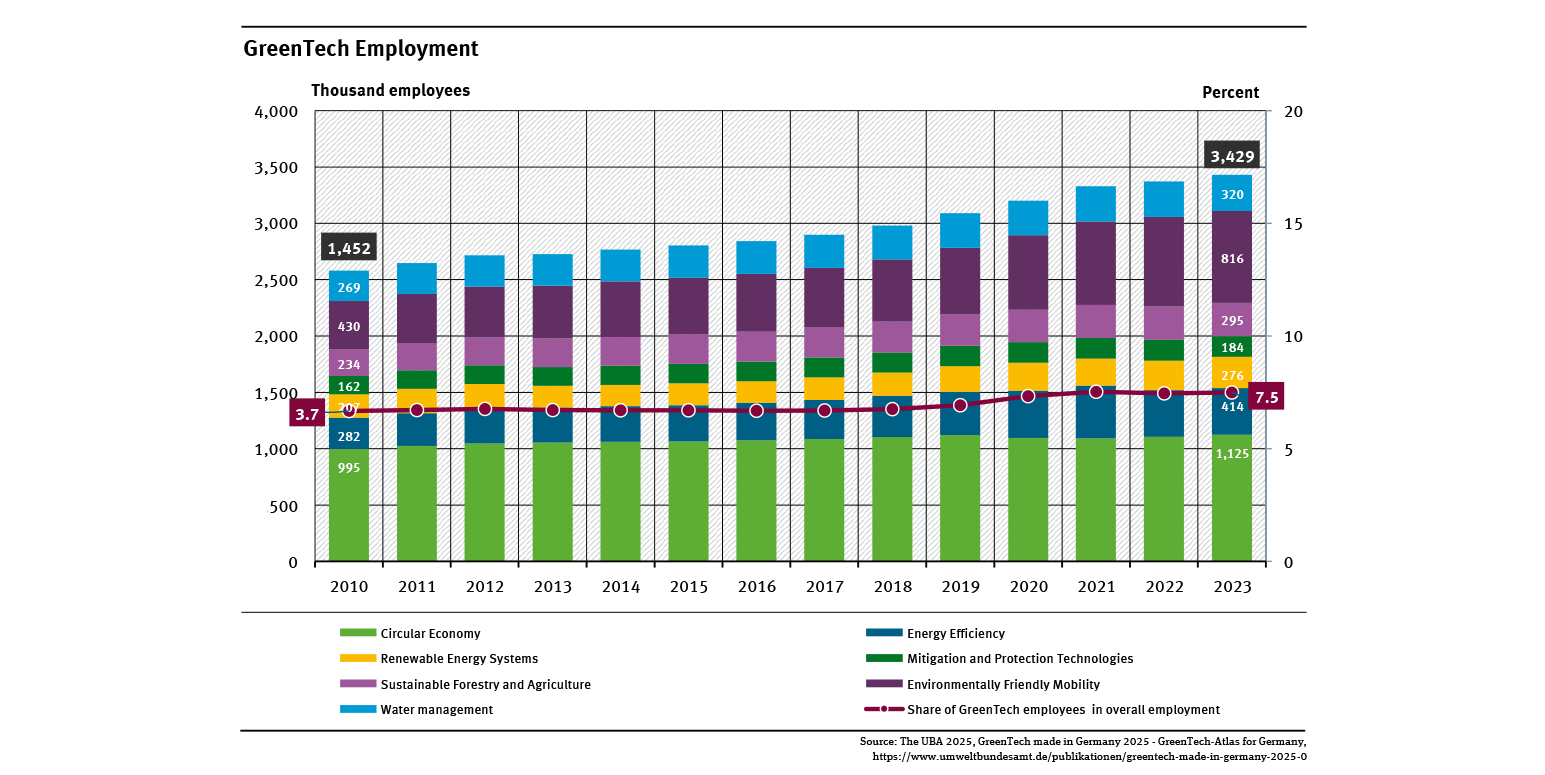
Employment in environmental protection

  • Umwelt und Wirtschaft
  • Diagramme
  • Umwelt-Indikatoren
  • Daten und Tabellen
Export data

You can also search in other data portals of the German Environment Agency

Short link: https://www.uba.de/n300701en