indicator

Umwelt-Indikator

Indicator: Recycling municipal waste

A graph shows the proportions of processed and recycled municipal waste in the total quantity of municipal waste from 2002 to 2023. During this period the proportion of recycled municipal waste rose from 56.1 to 67.2 percent.

The recycling rate for municipal waste rose from 56 % in 2002 to 67.2 % in 2023.The target set by the Federal Government of increasing the recycling percentage for municipal waste to 65 % by 2020 has therefore been achieved.However, there is still a need for action for individual subgroups of municipal waste. read more

Indicator: Amount of waste – municipal waste

A graph shows the amount of municipal waste from 2010 to 2023. During this period the amount decreased from 49.2 million tonnes to 48.9 million tonnes.

The volume of municipal waste fluctuates only slightly over time. In 2023 it stood at 48.9 million tonnes.The target of environmental policy is the avoidance of waste generation.This target has not been achieved for the municipal waste. To reduce resource consumption, municipal waste has to decline. read more

Indicator: Population exposure to particulate matter (PM10)

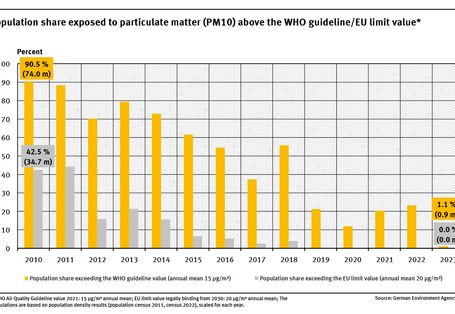
A graph shows the proportion of people in Germany affected by levels exceeding the WHO guideline value and the EU limit value for fine particulate matter (PM10) (legally binding from 2030) for the period from 2010 to 2023 – with a clear declining trend.

Between 2010 and 2023, the proportion of the population exposed to annual average PM10 concentrations above the WHO guideline value of 15 µg/m³ decreased from 90.5 % to 1.1 %.Since 2019, the share of the population exposed to PM10 levels above the EU limit value of 20µg/m³ (legally binding from 2030) has been below 0.5 %—and in 2023, it was 0 %.Current measures should be mainta... read more

Indicator: Population-weighted particulate matter exposure (PM10)

A bar-chart shows the population-weighted annual average PM10 exposure for Germany from 2010 to 2023. The exposure decreased significantly by 42 % from 2010 to 2023.

Population-weighted exposure to PM10 in Germany was significantly lower in 2023 than in 2010.In 2023, the population-weighted PM10 exposure was 11.3 µg/m³—approximately 42 % lower than in 2010.This decline in exposure is due to decreasing emissions from stationary sources (such as power plants, waste incineration facilities, residential heating, and industrial plants) as well as measures implement... read more

Indicator: Population-weighted particulate matter exposure (PM2.5

A bar-chart shows the population-weighted annual average PM2.5 exposure for Germany from 2010 to 2023. The exposure decreased significantly by 54 % from 2010 to 2023.

Population-weighted PM2.5 exposure in Germany was significantly lower in 2023 compared to 2010.In 2023, the population-weighted annual average PM2.5 exposure level was 7.3 µg/m³—around 54  % lower than in 2010.This decline in exposure is attributable to decreasing emissions from stationary sources (such as power plants, waste incineration facilities, residential heating, and industrial plants... read more

Indicator: Population exposure to particulate matter (PM2.5)

A graph shows the proportion of people in Germany affected by levels exceeding the WHO guideline value and the EU limit value for fine particulate matter (PM2.5) (legally binding from 2030) for the period from 2010 to 2023 – with a declining trend considering the EU limit value.

The proportion of the population exposed to annual average PM2.5 concentrations above 10 µg/m³ (the EU limit value legally binding from 2030) has decreased significantly in Germany since 2010.However, between 2010 and 2023, nearly the entire population was exposed to fine particulate matter concentrations exceeding the current WHO guideline value for PM2.5 (5 µg/m³ annual average).Therefore, furth... read more

Indicator: Organic farming

A graph shows the increase of the share of organic farming areas in total utilised agricultural area based on data of the German Federal Statistical Office and the BMLEH. It also shows the 30 percent target of the Federal Government.

According to the data of the German Federal Statistical Office, the share of area under organic farming of agricultural land increased from 2.9 % to 11.2 % from 1999 to 2024.The Federal Government aims to increase the proportion of organically cultivated areas in agricultural land to 30 % by 2030.At the growth rate of recent years, this aim is expected to be missed in 2030. read more

Indicator: Land-take for settlements and transport infrastructure

A graph in the form of a bar chart shows how many hectares of land per day in Germany were newly designated for settlements and transport infrastructure between 2000 and 2023. The chart also shows the four-year average.

Between 2019 and 2023, 51 hectares of land per day were newly dedicated to settlements and transport infrastructure.Originally, the increase was to fall to 30 hectares per day by 2020. According to the goals of the sustainability strategy, the daily increase now should be less than 30 hectares per day by 2030.The Integrated Environmental Programme of the Federal Environment Ministry specifies a re... read more

The Umweltbundesamt

For our environment