The basic pollution levels in German conurbations significantly exceed WHO recommendations from 2021 for particulate matter (PM2.5) and nitrogen dioxide (NO₂).In the vicinity of pollutant sources, pollution levels can even be significantly higher.The situation for NO₂ and PM2.5 has improved considerably since 2000, but the WHO recommendations for 2021 are still clearly exceeded.Ozone and PM2.5 pol... read more
Umwelt-Indikator
Indicator: Air quality in agglomerations

Indicator: Bathing water quality

All bathing waters in the EU were supposed to be of at least sufficient quality by 2015.97.9 % of inland bathing waters had excellent water quality in 2023. With that the target has been missed only slightly.Considering only those bathing waters that were explicitly assessed, 99.7 % of the bathing waters met the requirements in 2023.About 91 % of inland waters and almost 88 % of coastal bathing wa... read more
Indicator: Employment in environmental protection

In 2021, around 3.2 million people worked in environmental protection. That was 7.1 % of all employees.Of this, over half are environment-related services.Since 2002, employment in environmental protection has risen steadily and environmental protection has established itself as an important factor for the labour market. read more
Indicator: Environmental protection goods

Approximately 6 % of industrial production in Germany are used to protect the environment, e.g. for noise protection or climate mitigation.In 2021, potential environmental protection goods worth nearly 90.6 billion euros were produced in Germany.At 43 billion, climate protection accounts for the largest share. read more
Indicator: Greenhouse gas emissions

According to initial calculations, greenhouse gas emissions in Germany declined by exactly 46.1 % between 1990 and 2023.Germany aims to reduce greenhouse gas emissions by 40 % by 2020 and by at least 65 % by 2030 compared to 1990 emission levels. Complete greenhouse gas neutrality is to be achieved by 2045.In 2023, Germany was well below the target of minus 40 % set for 2020. The targets for 2030... read more
Indicator: Emission of air pollutants

The averaged index of air pollutants fell by 34.4% between 2005 and 2022.The obligations of the Gothenburg Protocol and the NEC Directive for 2020 were achieved.Safely meeting the commitments of the European NEC) Directive for 2030, is a challenge for the German environmental policy.Ammonia emissions must continue to be significantly reduced to achieve this. read more
Indicator: Land-take for settlements and transport infrastructure

Between 2019 and 2022, 52 hectares of land per day were newly dedicated to settlements and transport infrastructure.Originally, the increase was to fall to 30 hectares per day by 2020. According to the goals of the sustainability strategy, the daily increase now should be less than 30 hectares per day by 2030.The Integrated Environmental Programme of the Federal Environment Ministry specifies a re... read more
Indicator: Sustainable forestry
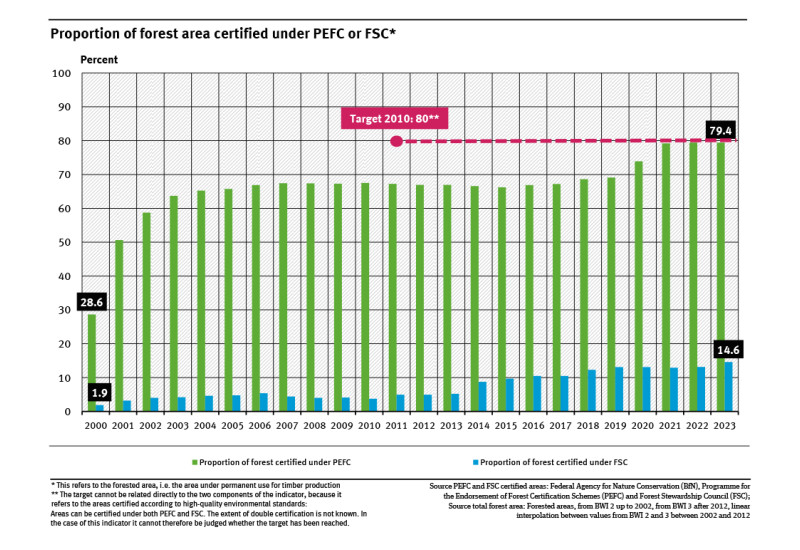
After a sharp rise between 2000 and 2003, the proportion of PEFC certified areas has stagnated until 2019. In 2023, the share was 10 percentage points higher than in 2019.Overall, the proportion of areas certified under FSC has developed very well since 2000. The proportion is far below that of PECF certified areas, however.The Federal Government wanted the forested area in Germany certified under... read more
