Indicator: Population exposure to particulate matter (PM10)

A graph shows the proportion of people in Germany affected by levels exceeding the WHO guideline value and the EU limit value for fine particulate matter (PM10) (legally binding from 2030) for the period from 2010 to 2023 – with a clear declining trend.Click to enlarge
Population share exposed to particulate matter (PM10) above the WHO guideline/EU limit value
Source: German Environment Agency Figure as PDF

Table of Contents


At a glance

  • Between 2010 and 2023, the proportion of the population exposed to annual average PM10 concentrations above the WHO guideline value of 15 µg/m³ decreased from 90.5 % to 1.1 %.
  • Since 2019, the share of the population exposed to PM10 levels above the EU limit value of 20µg/m³ (legally binding from 2030) has been below 0.5 %—and in 2023, it was 0 %.
  • Current measures should be maintained and, if necessary, expanded in order to meet the WHO guideline value for population exposure to PM10 by 2030.
 

Environmental importance

Particulate matter (PM) in ambient air is harmful to human health. The particles enter the human body through the respiratory system. Depending on the size of the particles, they can penetrate deeply into the respiratory system. Particularly small particles can enter the blood stream when penetrating the pulmonary tissue. There is clear evidence that particulate matter can trigger various diseases (see 'Particulate matter').

PM is primarily generated by human activities, such as combustion processes or mechanical wear (e.g., tire and brake abrasion from motor vehicles). Part of PM forms in the atmosphere through chemical reactions of gaseous air pollutants (such as nitrogen oxides and ammonia) and is therefore referred to as “secondary” particulate matter.

The indicator reflects the average annual PM10 exposure in Germany based on data from monitoring stations located in rural and urban background areas. Monitoring stations situated in areas with high traffic volumes or near large industrial facilities—where pollution levels are typically higher—are not included. As a result, the indicator may slightly underestimate the actual exposure level.


Assessing the development

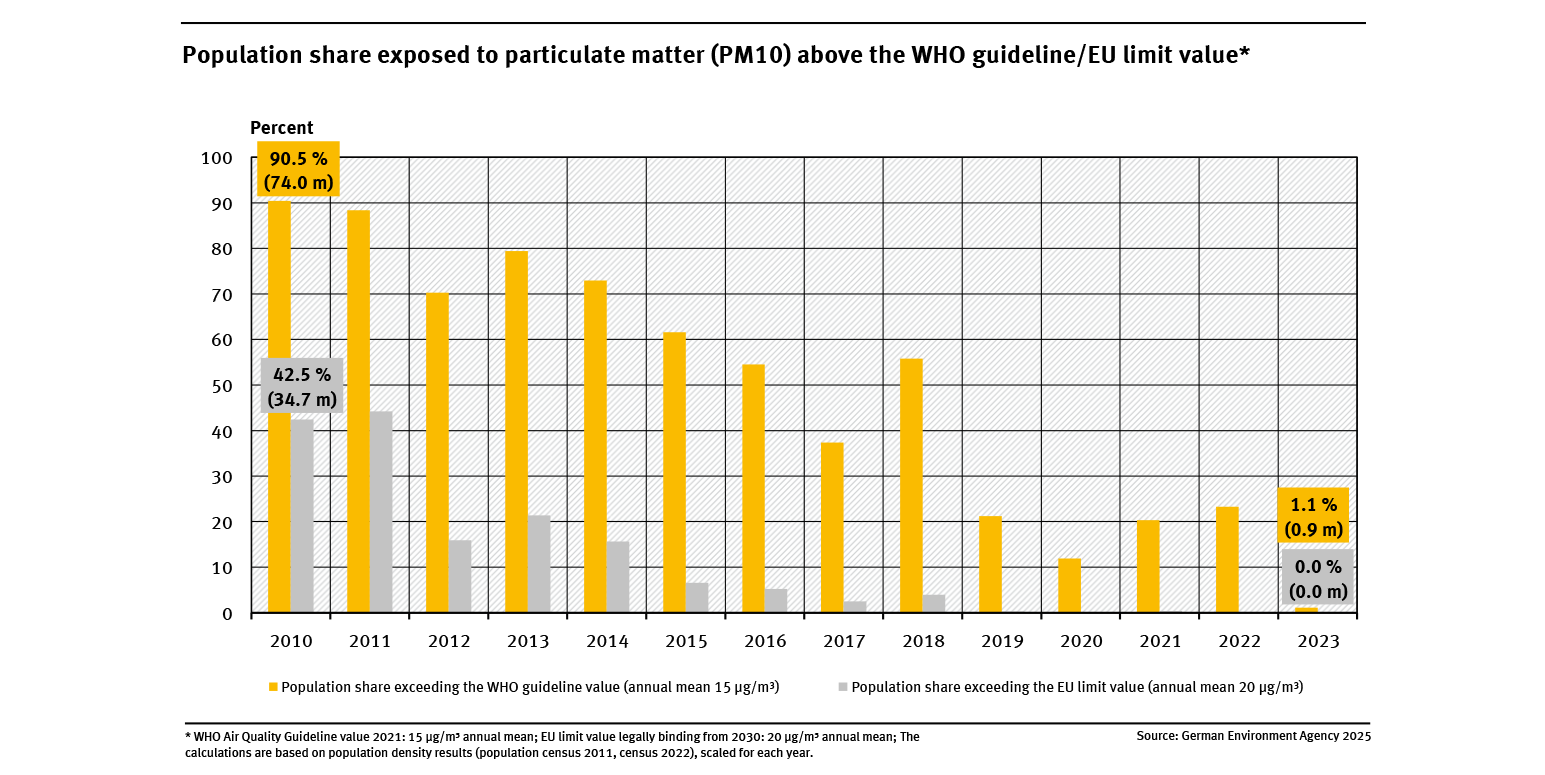
Throughout the entire observation period, a significant share of the German population was exposed to PM10 concentrations exceeding the WHO guideline value, which is 15 µg/m³ as an annual average. However, the number of people affected in Germany dropped significantly—from around 74 million in 2010 to 0.9 million in 2023. At the same time, the number of people exposed to PM10 concentrations above the EU limit value (20 µg/m³ annual average), which will become legally binding in 2030, decreased from 34.7 million in 2010 to 0.0 million in 2023. Since 2019, the proportion of the population affected has already been below 0.5 %. This clearly demonstrates that emission reduction measures implemented in recent years have already led to a substantial decrease in particulate matter pollution in Germany.A further decline in pollution levels is expected by 2030 as a result of the emission reduction commitments under the NEC Directive. If the measures outlined in national air pollution control programs are implemented (in Germany, for example, the coal phase-out, reduction of ammonia emissions from agriculture, and the transition to sustainable transport including e-mobility), emissions of particulate matter and its precursor gases can be further reduced by 2030. However, to better protect population health, more ambitious measures are needed—also at the European level—to further reduce particulate matter pollution.

In December 2024, the revised European Air Quality Directive entered into force. Under this directive, stricter limit and target values will be legally binding across Europe starting in 2030. For PM10, the new EU limit value legally binding from 2030 will be lowered from 40 to 20 µg/m³ (annual average), corresponding to the interim target 4 of the WHO recommendations.


Methodology

For this indicator, data from the chemical transport model REM-CALGRID are combined with PM10 measurement data from the air quality monitoring networks of the German federal states and the German Environment Agency (UBA), and applied across the area of Germany. Only monitoring stations that are not directly influenced by local PM emissions—such as those from traffic—are considered. The PM10 data are then combined with spatial information on population distribution. The methodological approach is described in detail in the scientific article by Kienzler et al. 2024 (in German, abstract in English).

Detailed information on this topic can be found in the data article ‘Bedeutung der Feinstaubbelastung für die Gesundheit (in German only).