Population

Umwelt-Indikator

Indicator: Population exposure to particulate matter (PM10)

A graph shows the proportion of people in Germany affected by levels exceeding the WHO guideline value and the EU limit value for fine particulate matter (PM10) (legally binding from 2030) for the period from 2010 to 2023 – with a clear declining trend.

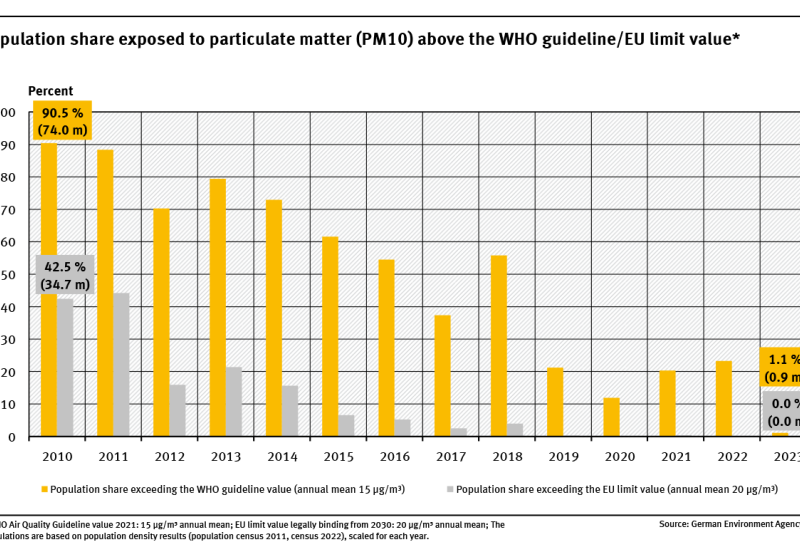
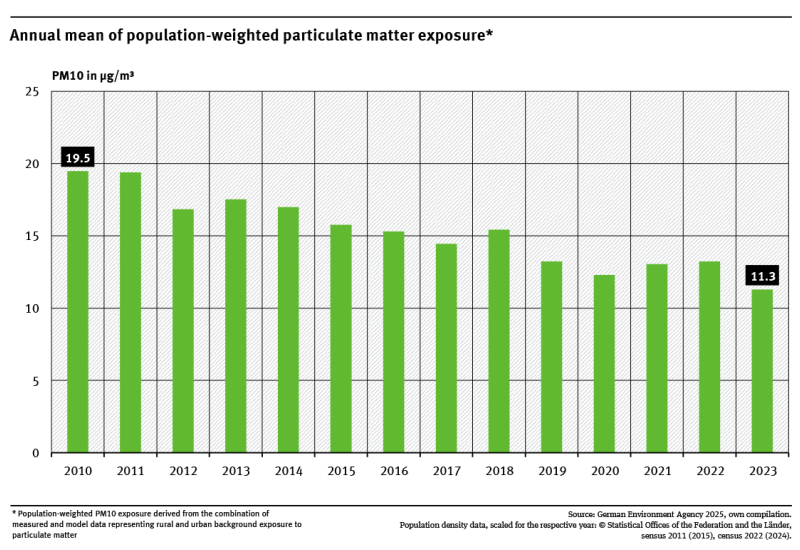
Between 2010 and 2023, the proportion of the population exposed to annual average PM10 concentrations above the WHO guideline value of 15 µg/m³ decreased from 90.5 % to 1.1 %.Since 2019, the share of the population exposed to PM10 levels above the EU limit value of 20µg/m³ (legally binding from 2030) has been below 0.5 %—and in 2023, it was 0 %.Current measures should be mainta... read more

Indicator: Population-weighted particulate matter exposure (PM10)

A bar-chart shows the population-weighted annual average PM10 exposure for Germany from 2010 to 2023. The exposure decreased significantly by 42 % from 2010 to 2023.

Population-weighted exposure to PM10 in Germany was significantly lower in 2023 than in 2010.In 2023, the population-weighted PM10 exposure was 11.3 µg/m³—approximately 42 % lower than in 2010.This decline in exposure is due to decreasing emissions from stationary sources (such as power plants, waste incineration facilities, residential heating, and industrial plants) as well as measures implement... read more

Indicator: Population exposure to particulate matter (PM2.5)

A graph shows the proportion of people in Germany affected by levels exceeding the WHO guideline value and the EU limit value for fine particulate matter (PM2.5) (legally binding from 2030) for the period from 2010 to 2023 – with a declining trend considering the EU limit value.

The proportion of the population exposed to annual average PM2.5 concentrations above 10 µg/m³ (the EU limit value legally binding from 2030) has decreased significantly in Germany since 2010.However, between 2010 and 2023, nearly the entire population was exposed to fine particulate matter concentrations exceeding the current WHO guideline value for PM2.5 (5 µg/m³ annual average).Therefore, furth... read more

Indicator: Population exposure to traffic noise

A graph shows the proportion of people exposed to traffic noise above 55 decibels during the day and above 50 decibels at night, as observed in the 2022 noise mappings. It differentiates between road, aircraft and rail traffic noise.

According to the 2022 noise mapping, about 17.9 % of the total population was adversely affected by night-time noise.They further showed that 26.3 % of the population was exposed to a noise level of above 55 decibels during the day.The main source of noise is road traffic. Aircraft noise hardly plays a role in the area assessment.Noise that exceeds exposure limits can lead to health problems. read more

Health

Reference and HBM Values

Urine and blood specimen in tubes on a questionaire for laboratory analysis

The reference value allows the comparison of the exposure of individuals or population groups with the background exposure. Since environmental conditions are changing reference values are checked continuously and are updated if new information becomes available.The reference value for a chemical substance in human biological material (e.g. blood, urine) is derived according to a defined statistic... read more

The Umweltbundesamt

For our environment