Slight decline in greenhouse gas emissions in Germany in 2017
Germany produced a total of 906.6 million tonnes of CO2 equivalents in 2017 -- 4.4 million tonnes (0.5%) less than in 2016, and 27.5% less than in 1990. These are the results of inventory calculations which the German Environment Agency (UBA) has submitted to the European Commission. “By 2030 emissions must be cut to at least 55 percent below 1990 levels, and to 70 percent by 2040. The transport sector in particular continues to be moving in the wrong direction: emissions rose once again and are already two percent higher than in 1990. Ever increasing numbers of vehicles, more road freight transport and ever larger and heavier cars of course increase emissions. Something must finally be done in this sector,” said UBA’s President Maria Krautzberger.
Total emissions from the transport sector in 2017 amounted to nearly 168 million tonnes of CO2 equivalents. Road traffic accounts for the greatest share (over 96 percent), where 2017 emissions rose by 2.1 million tonnes of CO2 equivalents.
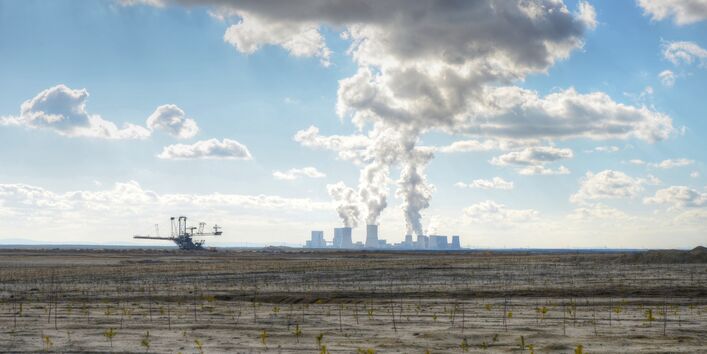
The most noticeable reductions occurred in the energy sector with a decrease of 19.5 million tonnes. Despite continued high trade surpluses from electricity trading, emissions were down to 313 million tonnes due to less consumption of lignite, greater use of renewable sources of energy (esp. wind power) and the shutdown and or switch to security standby of nuclear power capacities.
Emissions from agriculture in 2017 also declined slightly compared to the previous year, to 66 million tonnes of CO2 equivalents, or 0.4% less than the previous year and 16.3% under 1990 levels. This is due mainly to lower levels of application of mineral fertilisers.
In contrast, emissions in industrial processes rose by 2.5%, to a total of 64 million tonnes over the previous year. The main driver of the trend is growth in the metals and cement industries. Developments in other sectors effectively balance each other out.
Emissions by greenhouse gas
Carbon dioxide led the group of greenhouse gas emissions once again in 2017, accounting for 88 percent of total emissions and due mainly to the combustion of fossil fuels. The remaining emissions are distributed as follows: methane (CH4) at 6.1%, nitrous oxide (N2O) at 4.2%, for which agriculture is the main source. Carbon dioxide emissions have declined by 24.2 percent since 1990; methane by 54.3% and nitrous oxide by 41.3%.
Fluorinated greenhouse gases (F gases) cause only about 1.7% of all greenhouse gas emissions but some have a very high global warming potential. The trend in emissions development is less consistent: since the introduction of new technologies and the use of these substances as substitutes, emissions of sulphur hexafluoride (SF6) and chlorofluorocarbons (CFC) have been come down by 34.4% and 88.9%, respectively, since 1995. Emissions of hydrofluorocarbons (HFCs), however, have increased by 32.2% in the same period.
Further information and links:
The discrepancies in emissions inventories and initial calculations of GHG emissions for 2017 (see Press Release 8/18) are due to updates to earlier available data.
Updated and detailed overviews of greenhouse gas inventories for the period 1990 – 2017 are available here.
Short-term forecasts of greenhouse gas emissions in 2018 will be published in March 2019.


