Final account of 2019 greenhouse gases in Germany: Emissions declined by 35 per cent over 1990 levels
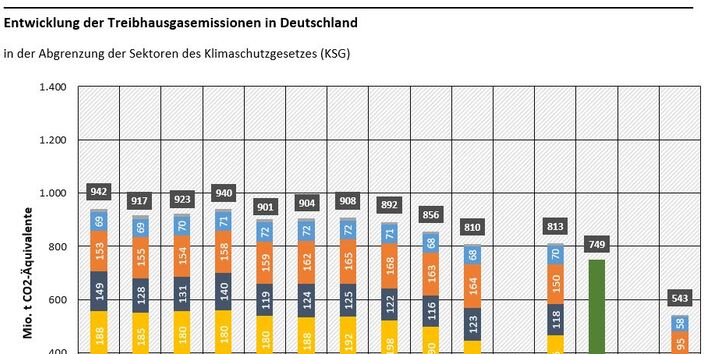
Germany emitted a total of 809.8 million tonnes of CO2 equivalents in 2019. This is around 46 million tonnes or 5.4% less than in 2018, and 35.1% less compared to 1990, according to the results of calculations submitted by the German Environment Agency (UBA) to the European Commission. Emissions have fallen most significantly in the energy sector. At 444.3 million tonnes of CO2 equivalents in the non-emissions trading sector (mainly transport and buildings), Germany once again exceeds its budget from the Effort Sharing Decision (ESD). Unlike in 2016, 2017 and 2018, Germany cannot compensate for the 2019 surplus with surpluses from previous years. Whether Germany will subsequently have to buy emission allowances from other EU states to compensate depends on the development in 2020. If greenhouse gas emissions in the transport and buildings sectors are shown to have decreased significantly in 2020, the 2019 deficit could still be balanced out. Otherwise, Germany would have to buy emission allowances. The decision on this will probably be made in 2022 once final emissions for 2020 have been determined.
The energy industry significantly reduced its greenhouse gas emissions in 2019, by 49.6 million tonnes or 16.6%. Three main factors led to this reduction: (1) a reduced use of emission-intensive coal-fired power plants in favour of gas-fired power plants. In addition to low world market prices for gas, the successful reform of European emissions trading, which led to higher CO2 prices, is particularly noticeable in this context. As a result, the operation of gas-fired power plants was more economical again. (2) In 2019, hard coal-fired power plants with a total capacity of 3.5 gigawatts were decommissioned or transferred to the grid reserve. The lignite-fired power plant units transferred to safety standby in 2019 also contributed to the reduction. (3) Furthermore, the contribution of renewable energies to electricity production increased significantly in 2019. However, this is not primarily due to the construction of new plants, but to particularly windy and sunny weather.
In contrast, emissions from households and the trade, commerce and services sector rose by seven million tonnes of CO2 equivalents or 9.4%. This increase is due in particular to increased heating oil sales as a result of low heating oil prices.
After the significant decrease in 2018, greenhouse gas emissions from the transport sector also increased slightly again in 2019. The figure of 165.5 million tonnes of CO2 equivalents is just under one percent above the previous year's value and thus also above the 1990 level. This development continues to be driven by road transport. Due to the higher number of vehicles and increases in transport performance, fuel sales and thus emissions increased compared to the previous year (by 1.2% compared to 2018). Improvements in the efficiency of new motor vehicles could only dampen the increase in emissions from transport, but not prevent it.
Due to the end of coal mining in 2018, so-called "diffuse" greenhouse gas emissions, e.g. from the release of mine gas, fell by 1.4 million tonnes of CO2 equivalents(16.4%).
Slight reductions were also achieved in the area of industrial processes. Here, emissions fell by three% or 1.9 million tonnes of CO2 equivalents, mainly due to reduced emissions in the steel industry in particular.
In agriculture, greenhouse gas emissions also fell slightly by 0.65 million tonnes to 61.8 million tonnes of CO2 equivalents. This continues the trend of the past years. Furthermore, less mineral fertiliser was used and livestock numbers decreased.
Dirk Messner, President of the German Environment Agency, comments, "These trends illustrate what must be achieved in the coming years: A rapid expansion of renewable energies is necessary, and breakthroughs in climate protection must finally be achieved in the transport, building, industry and agriculture sectors. It is the only way we can achieve our more ambitious climate goals."
Emissions by greenhouse gas
Carbon dioxide (CO2) continues to dominate greenhouse gas emissions in 2019 with almost 88% - most of which comes from the combustion of fossil fuels. The remaining emissions are divided between methane (CH4) (6%) and nitrous oxide (N2O) (4.3%), predominantly from the agricultural sector. Compared to 1990, emissions of carbon dioxide were down by 32.4%, methane by 58.2% and nitrous oxide by 45.9%.
Fluorinated greenhouse gases (F-gases) account for only about 1.7% of greenhouse gas emissions in total, but some of them have a very high global warming potential. Since 1995, fluorinated greenhouse gas emissions have fallen by 18.2%. The development of the F-gas groups is less uniform: depending on the introduction of new technologies, as well as the use of these substances as substitutes, SF6 and HFC emissions have decreased significantly since 1995, whereas HFC emissions have increased considerably since then. Emissions of the fluorinated gas nitrogen trifluoride (NF3) have increased at a low level since 1995.
Background: Effort-Sharing Decision (ESD)
The effort-sharing legislation set binding annual targets for EU Member States to reduce greenhouse gas emissions in the periods 2013-2020 and 2021-2030. These targets cover emissions from most sectors not covered by the EU ETS, such as transport, buildings, agriculture and waste, but also parts of the industrial sector.
The EU Commission is responsible for the exact calculation of the emissions relevant for the ESD and thus also of any necessary additional purchases of certificates. In addition to credits from previous years and the purchase of additional certificates, an excess can also be offset against possible savings in 2020.
Further information
The changes compared to the published first estimate of GHG emissions for 2019 (see press release 11/2020 of 16.03.2020) are due to updates of the preliminary statistical information at that time.
In accordance with the Climate Change Act, UBA will present the official estimate for 2020 emissions in mid-March 2021.


